
Most product research starts with revenue, search volume, and competition.
Those metrics are useful, but they don't answer the most important question: is this actually a good product to launch?
A product can generate strong revenue and still fail because of poor margins, limited differentiation, high advertising costs, or customer expectations that are difficult to meet.
This guide walks through the five phases used to evaluate a product before sourcing begins: generic research, initial validation, market research, financial study, and feedback research.
Phase 1 · Generic Research
Every product evaluation starts with a list of potential opportunities.
One of the simplest ways to build that list is by browsing Amazon's New Releases. Move through different categories and subcategories, exposing yourself to as many products as possible. You're not looking for one specific product. You're looking for products worth investigating.
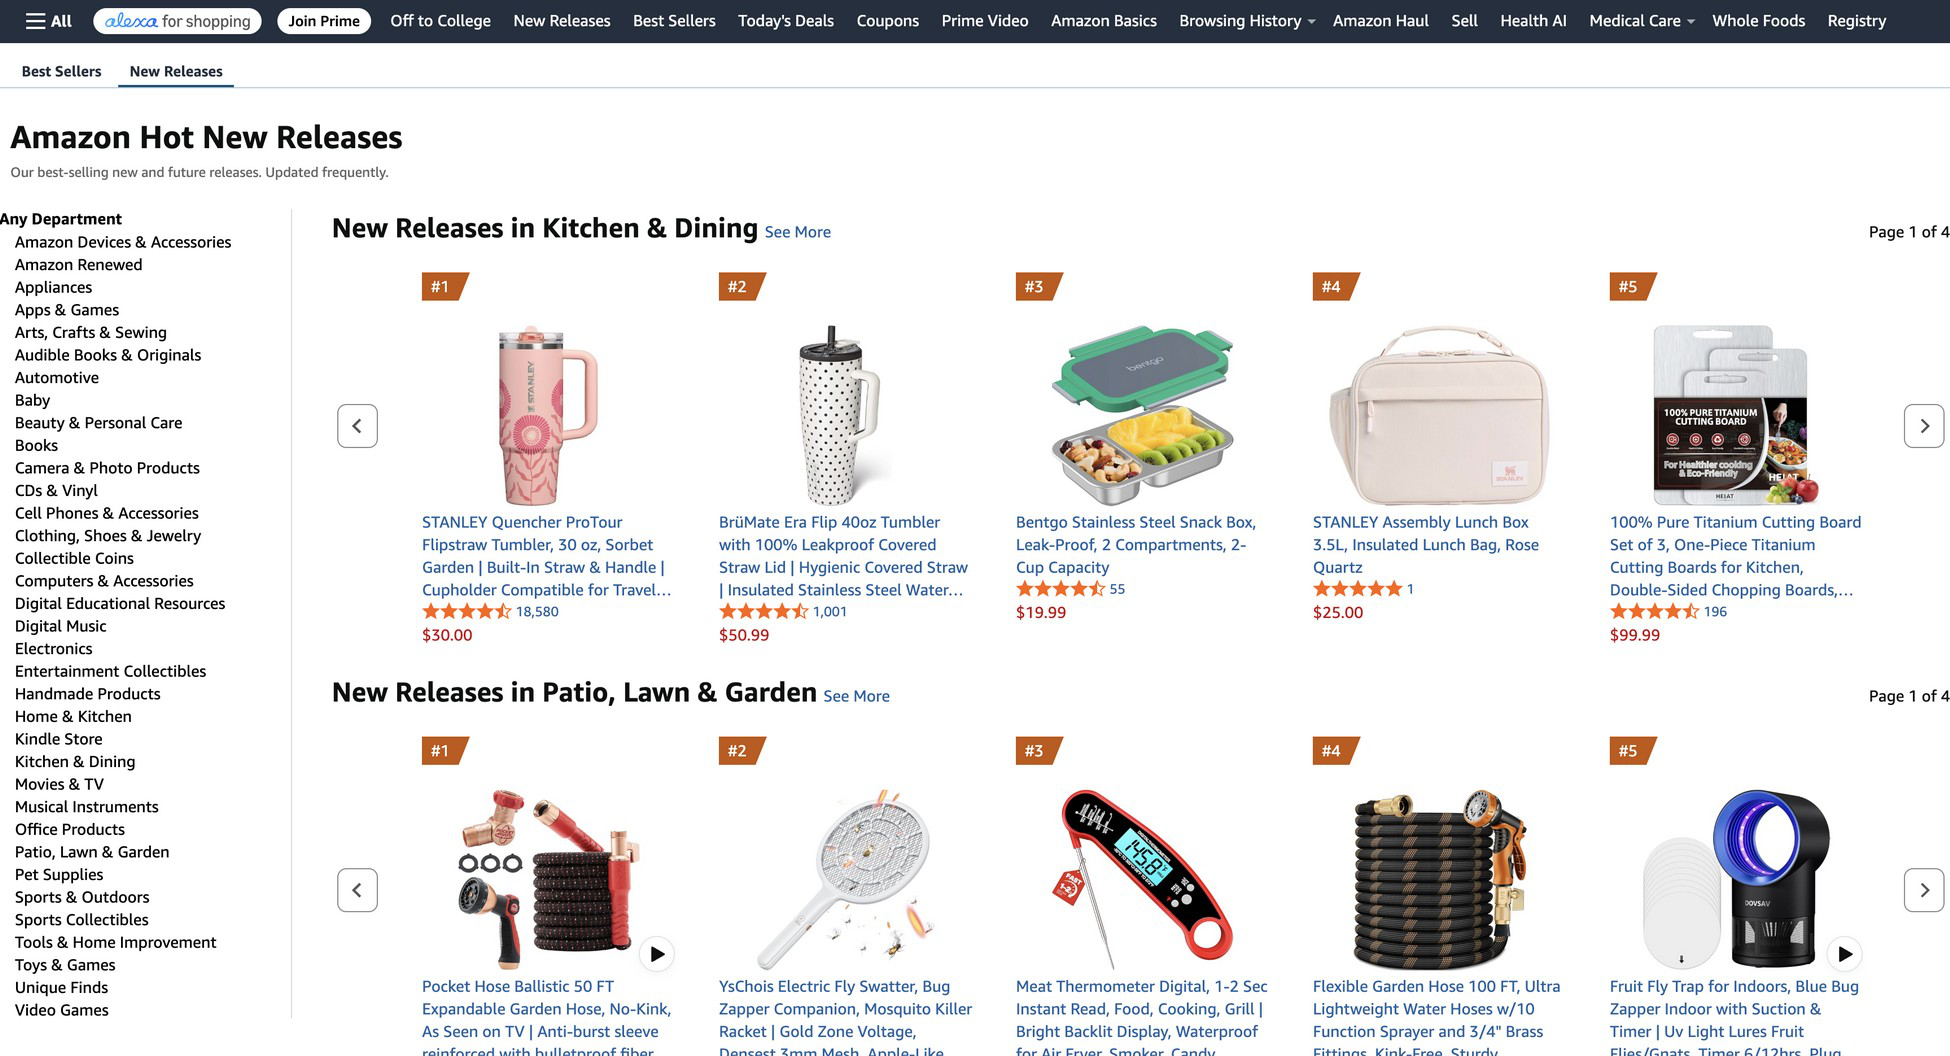
When something catches your attention, save it and keep moving.
Don't stop to study competitors or calculate profit margins. There will be plenty of time for that later. Right now, the priority is finding enough opportunities to evaluate.
After enough research, certain products will stand out almost immediately. That's simply a result of seeing enough markets over time.
Keep adding products until you've built a pipeline worth evaluating.
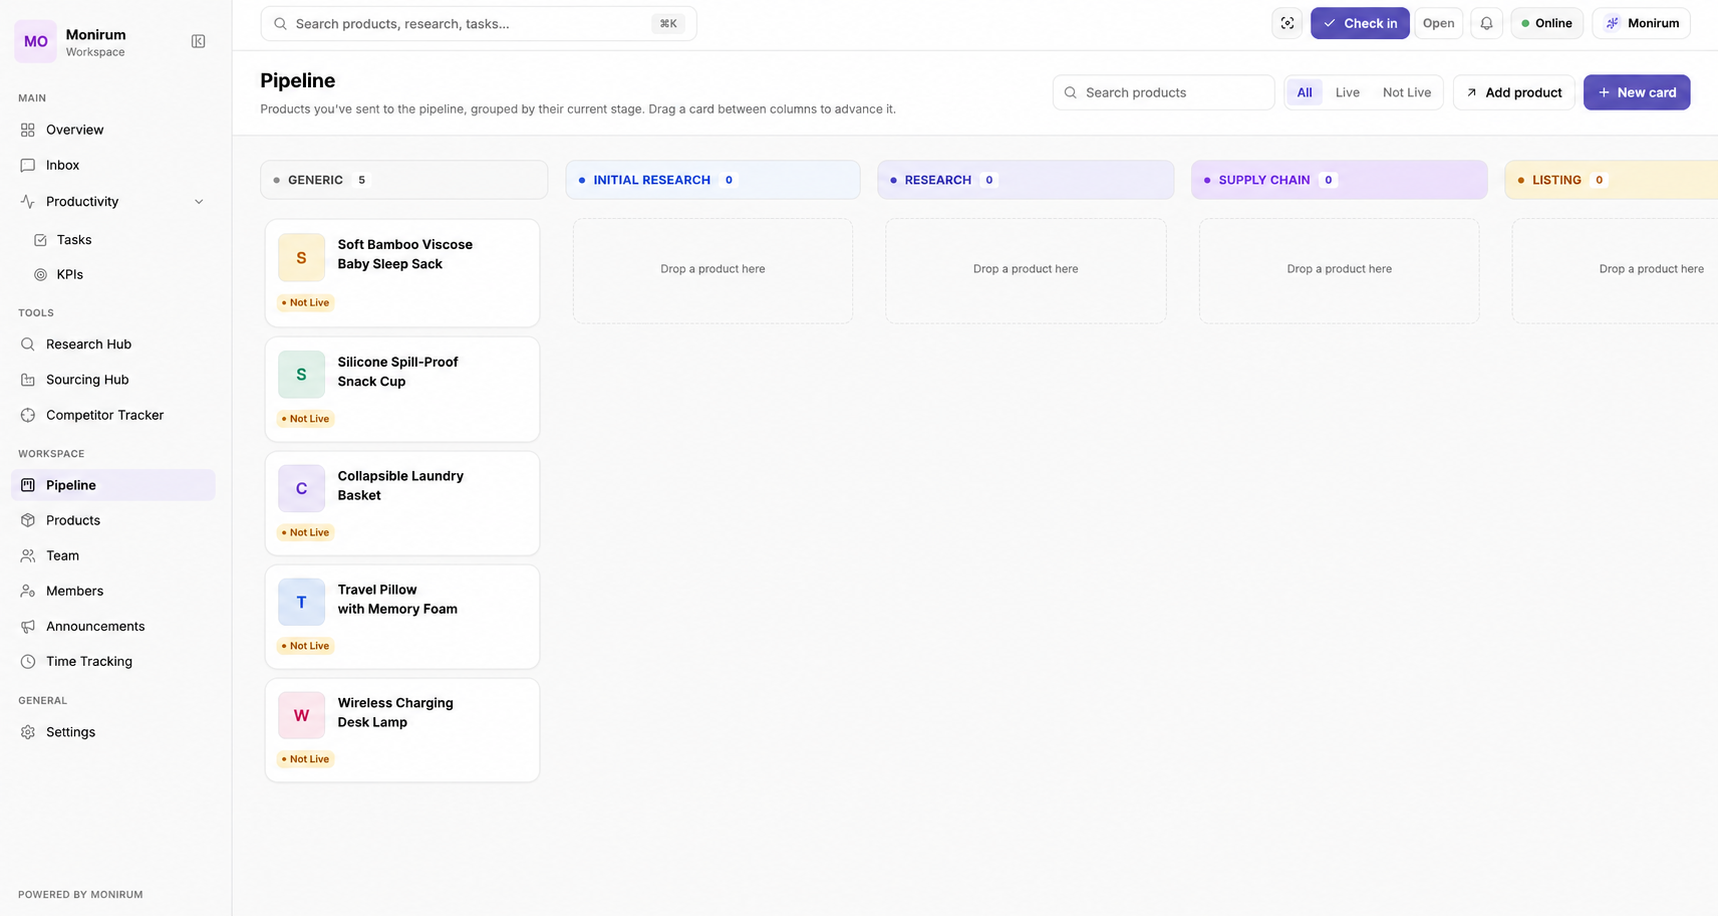
Once the pipeline is ready, evaluate each product individually during the Initial Validation phase.
Phase 2 · Initial Validation
A product reaching this stage doesn't mean it's a good opportunity. It means it has done enough to justify a closer look.
The purpose of Initial Validation is to decide whether the product deserves the time required for a complete market analysis. Most products won't.
Start by opening the product listing and identifying the businesses already competing in that market.

The first thing to understand is who the competitors are.
Some markets are dominated by a small number of brands. Others are distributed across many independent sellers. Neither is automatically good or bad. Whether a market is worth entering depends on your strategy, available capital, experience, and the level of competition you're prepared to face.
This is also the stage to understand the product itself.
- What problem does it solve?
- What are the core features?
- What variations already exist?
- Are there obvious improvements, or has the product already reached a mature stage where most competitors offer the same experience?
These observations will become useful later when building the product specification.
Competition is only one part of the evaluation. The product itself also needs to fit the business you're trying to build.
Before moving forward, compare the product against the criteria established before the research began.
There are no universal requirements. Every business has its own strategy, capital, risk tolerance, and operational constraints. A product that makes sense for one seller may be rejected immediately by another, even if both are looking at the same market.
Initial Validation isn't about deciding whether a product is objectively good. It's about deciding whether it fits the business that's evaluating it.
Manufacturing cost should also be estimated at this stage.
A quick search on Alibaba is usually enough to understand the general cost range. Supplier pricing should not be treated as a quotation, but it provides enough information to estimate whether the margins are likely to support further research.
Seasonality should also be checked before investing more time.
A seasonal product isn't necessarily a bad opportunity, but it changes inventory planning, launch timing, and cash flow. Understanding that early prevents unrealistic sales expectations later in the process.
Finally, check whether the product is protected by patents before investing additional time into the market.
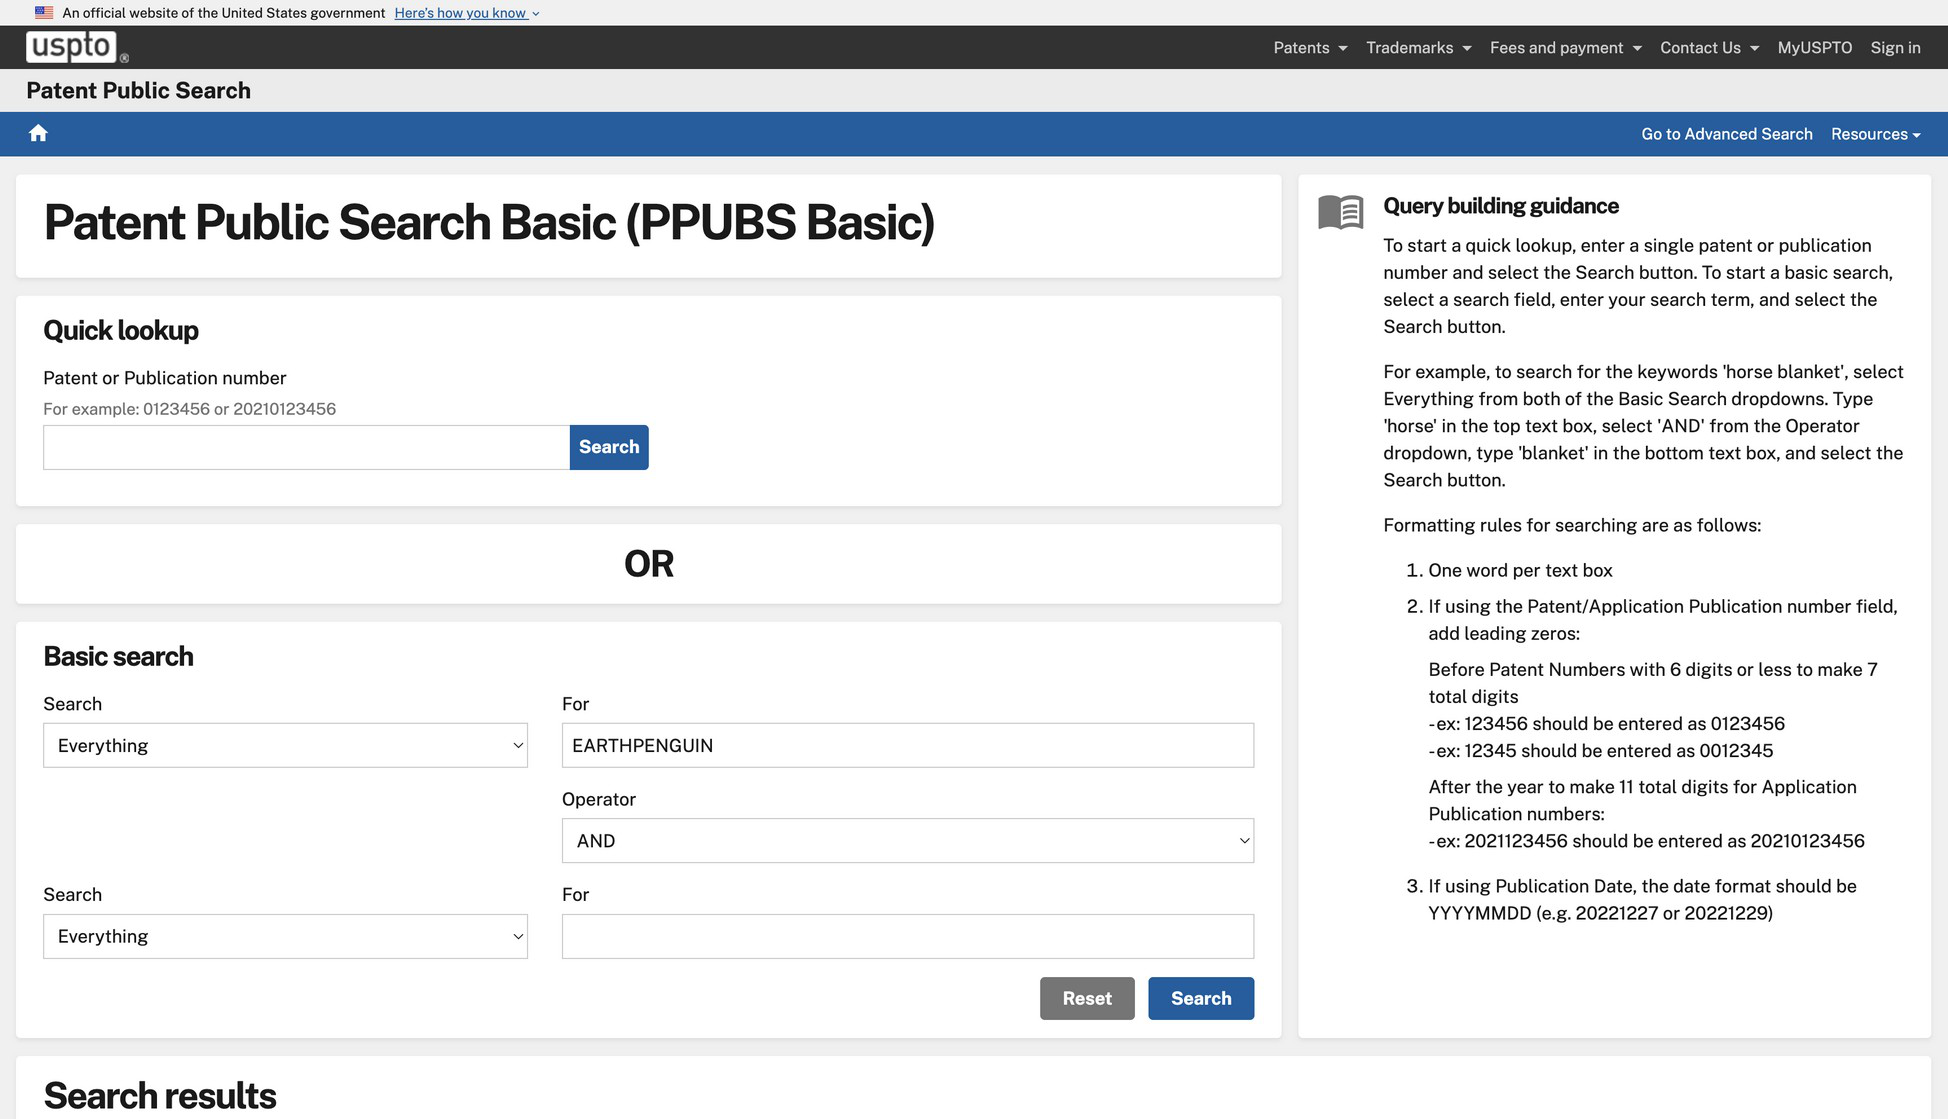
Finding patent restrictions after completing market research, financial planning, and sourcing work is an unnecessary risk that can usually be avoided with a preliminary review.
A product that passes Initial Validation hasn't been approved for launch. It has simply earned the time required for a complete market evaluation.
Phase 3 · Market Research
If a product reaches this stage, it has already passed the initial screening process. The next step is to understand the market behind it.
A product doesn't compete on its own. It competes against businesses that have already established pricing, product positioning, customer expectations, and market share. Evaluating a product without understanding that environment often leads to decisions based on incomplete information.
Market Research focuses on understanding how the market operates. Instead of looking at a single listing, the analysis expands to the entire competitive landscape, revealing where demand exists, how revenue is distributed, what customers expect at different price points, and where opportunities may exist.
Market Share
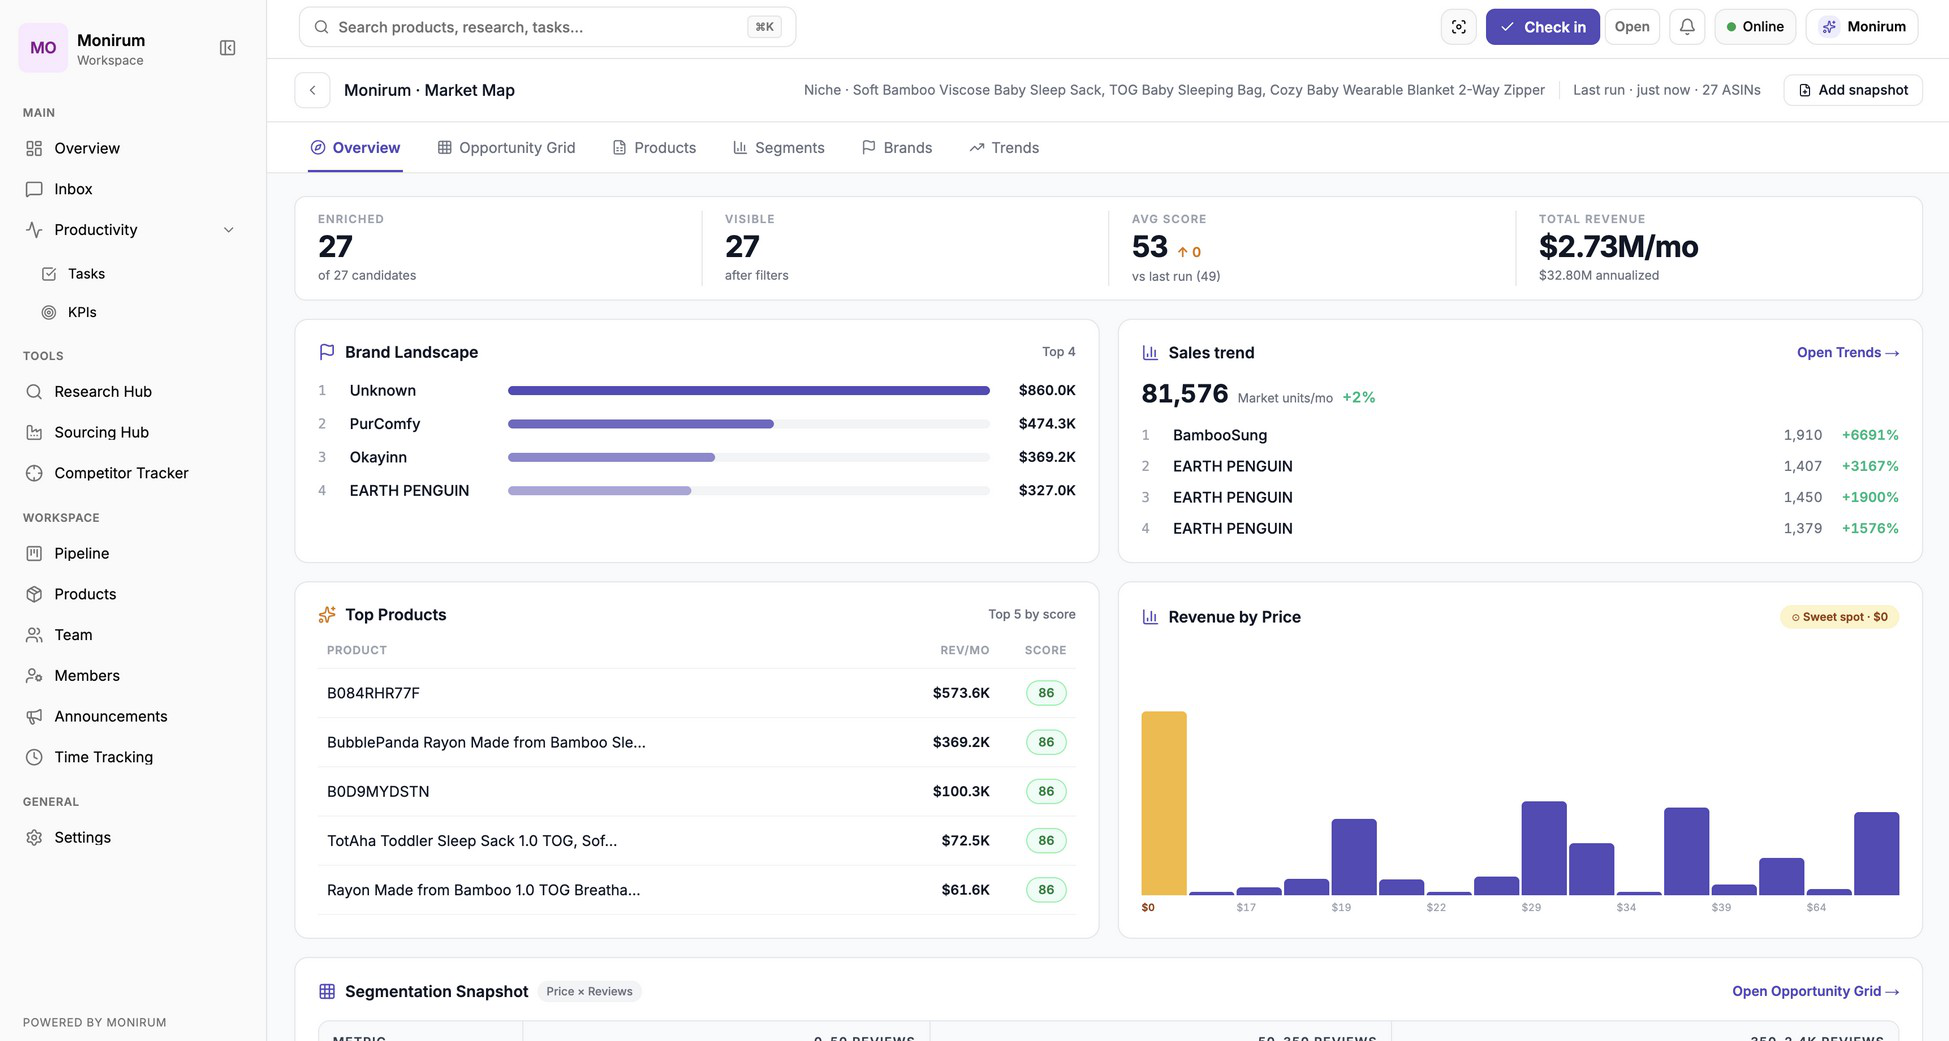
The first step is understanding how revenue is distributed across the market.
A market where a few sellers generate most of the revenue is very different from one where sales are spread across dozens of competitors. Neither structure is inherently better. Each presents different challenges and opportunities depending on the business evaluating it.
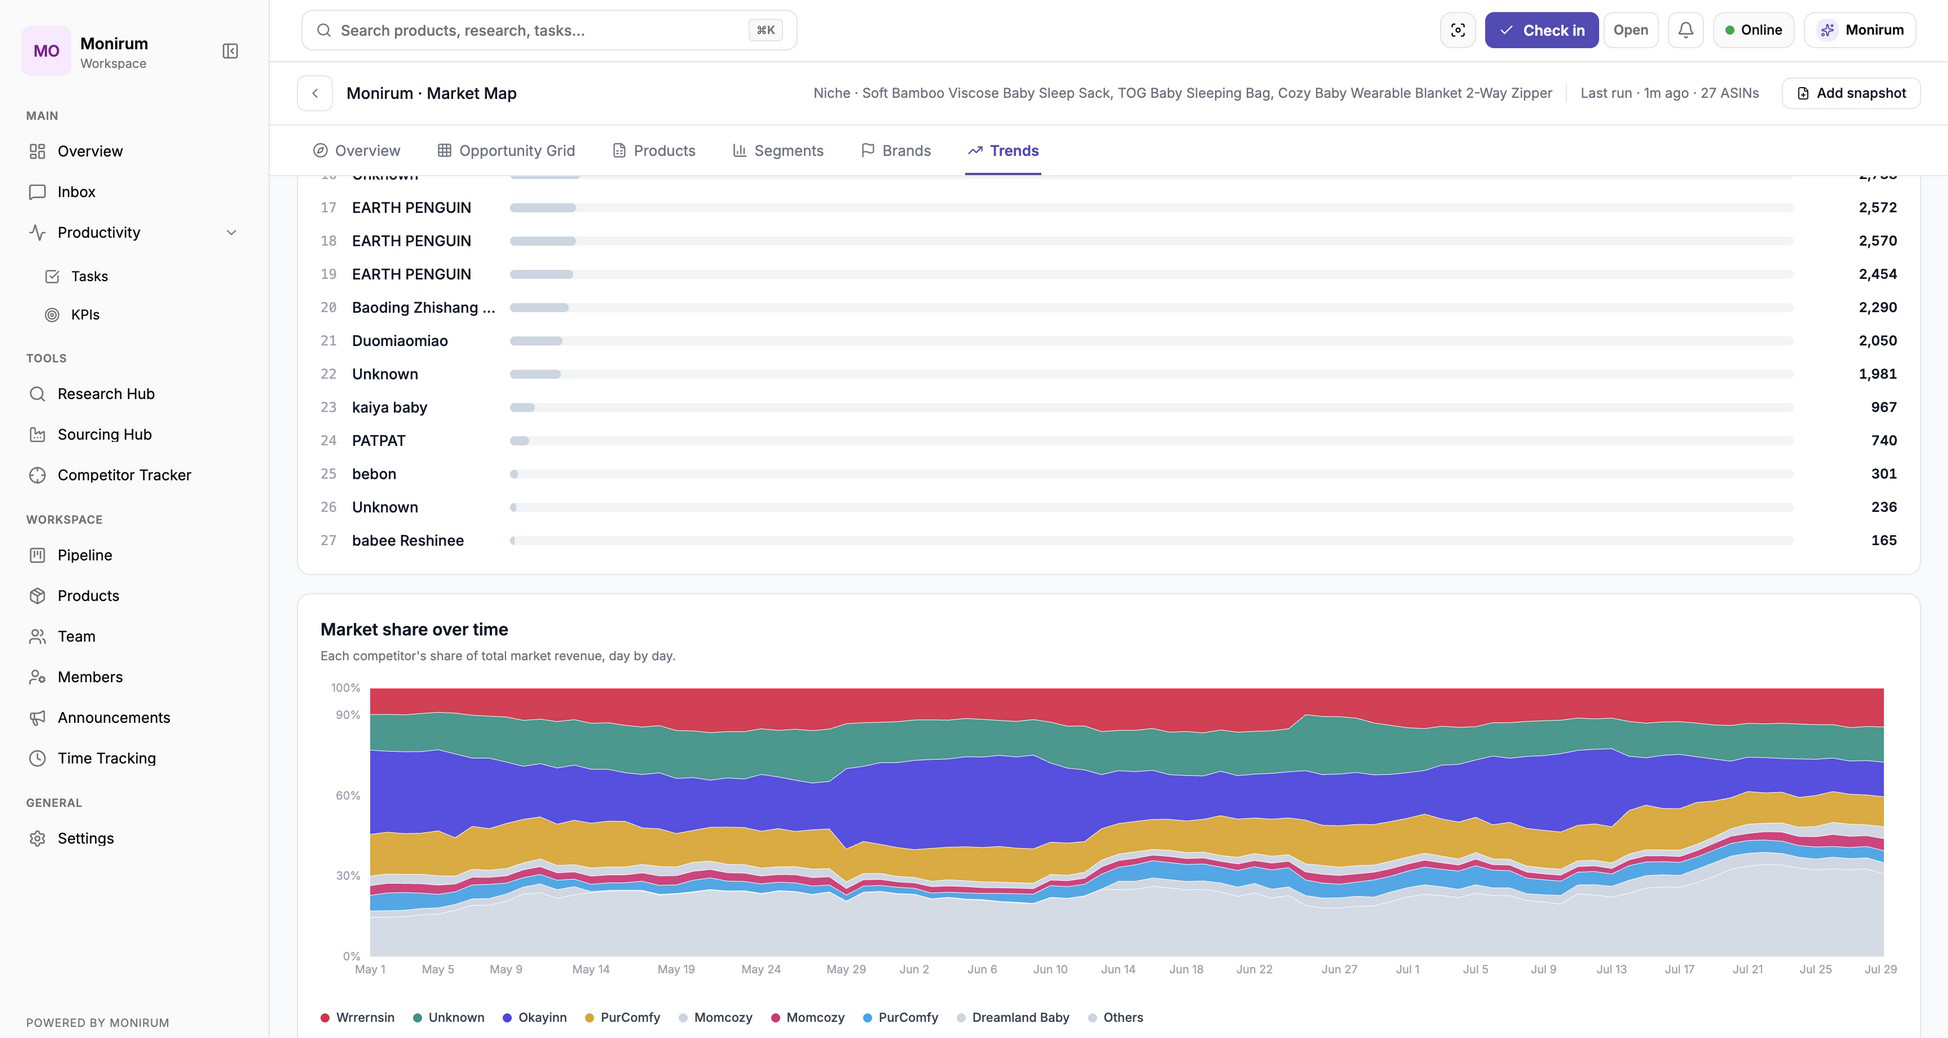
Market share provides context that individual product listings cannot. A listing may appear successful on its own, but it reveals very little about the market as a whole. Looking at revenue distribution makes it easier to identify market leaders, understand how concentrated the competition is, and assess how difficult it may be to establish a meaningful position.
Two distributions come up most often, and they change what the rest of the research is looking for.
When a small number of listings hold most of the revenue, the category total is misleading. That revenue isn't available. Entering means taking sales from specific listings, so the question becomes what would make a buyer choose a new product over the one currently winning. Concentrated markets also tend to carry high review counts and expensive advertising at the top, because the leaders have been defending those positions for a while.
When revenue is spread across many sellers, there's no single listing to displace, but the spread has two possible causes and they point in opposite directions. It can mean the market contains genuinely different buyer needs, in which case the segments are worth mapping and one of them may be underserved. It can also mean no product has found a decisive advantage and everyone is competing on price. Price and review segmentation is what separates the two.
What this stage produces is a realistic ceiling. A financial model built on category revenue rather than the share a new product could plausibly reach will overstate every number that follows from it.
It's equally important to understand that market share represents the current state of the market, not its future. A dominant seller today doesn't guarantee long-term dominance, just as a fragmented market doesn't automatically make entry easier. Market share should be interpreted alongside the rest of the research rather than used as a standalone decision-making metric.
Brand Analysis
Market share explains how revenue is distributed. Brand analysis explains who controls it.
Some markets are dominated by a handful of established brands, while others are shared among dozens of smaller sellers. Understanding that structure helps put the level of competition into perspective and provides a clearer picture of the businesses already operating in the market.
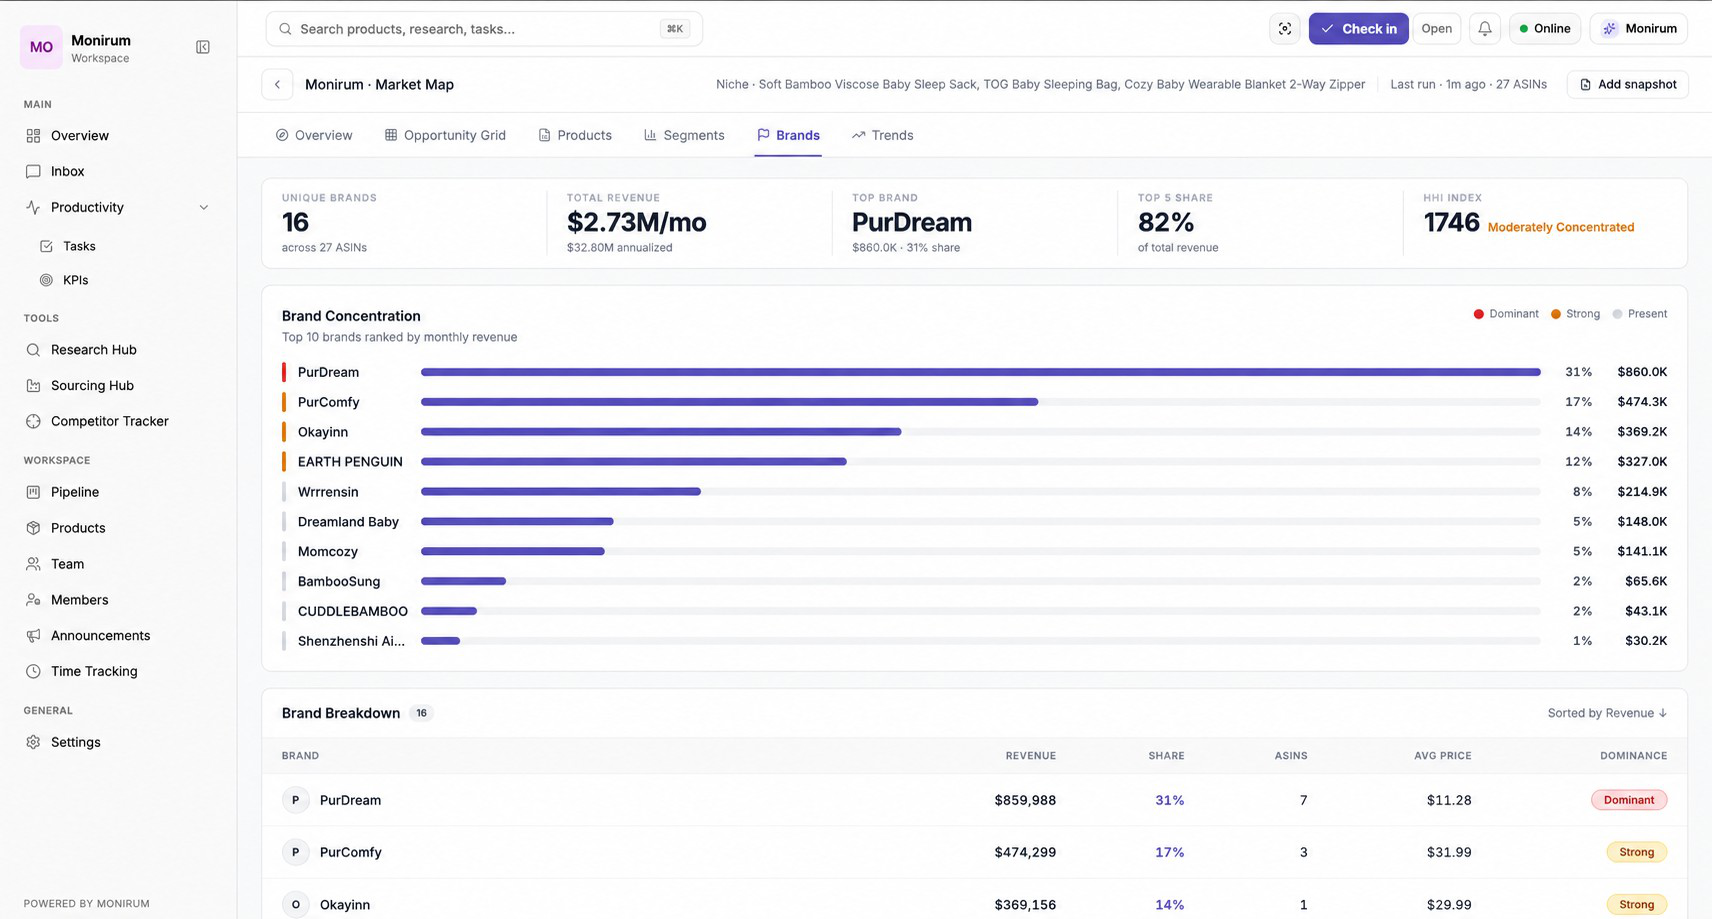
This stage isn't about judging whether a market has too many brands or too few. Instead, it focuses on understanding the type of competition. Are the leading sellers established brands with strong customer recognition, or are they private label businesses competing primarily on product quality, pricing, and positioning? The answer often influences the strategy required to enter the market successfully.
Two structures come up most often, and they point toward different strategies.
The first is a market held by a small number of established brands that have kept their positions for years. Their listings are mature, their review counts are high, and newer entrants appear low in the results and stay there. In this structure, visibility is the constraint rather than product quality. A comparable product competes for attention against brands customers already recognize, and that attention is usually bought through advertising until organic ranking improves. Entry remains possible, but it generally requires a product the leaders don't offer or a segment they have chosen not to serve. Matching the category leader on the same product rarely works, because the customer has no reason to switch.
The second is a market where positions move. Brands that didn't exist two years ago hold meaningful share, and the top of the category looks different than it did in recent sales history. Customers are still considering alternatives, and ranking is being earned rather than defended. A strong version of the standard product can succeed here without a structural differentiator. The same openness applies after launch, which means the position will be harder to hold than to take.
A third case is worth separating out because it is frequently misread. A market with many brands and no clear leader can look accessible, but fragmentation sometimes reflects low barriers combined with thin margins rather than an opening. If dozens of sellers compete at similar prices with similar products, the reason no one has consolidated the market may be that consolidating it isn't profitable. This is a case to carry into the financial study rather than treat as a positive signal.
Brand analysis doesn't produce a verdict on the market. It produces a constraint on strategy: whether the plan needs a differentiated product, an underserved segment, or an advertising budget large enough to buy visibility in a category that has already settled.
Sales History
A single month's sales rarely tell the full story. Sales history provides the context needed to understand whether demand is stable, growing, declining, or driven by temporary events.
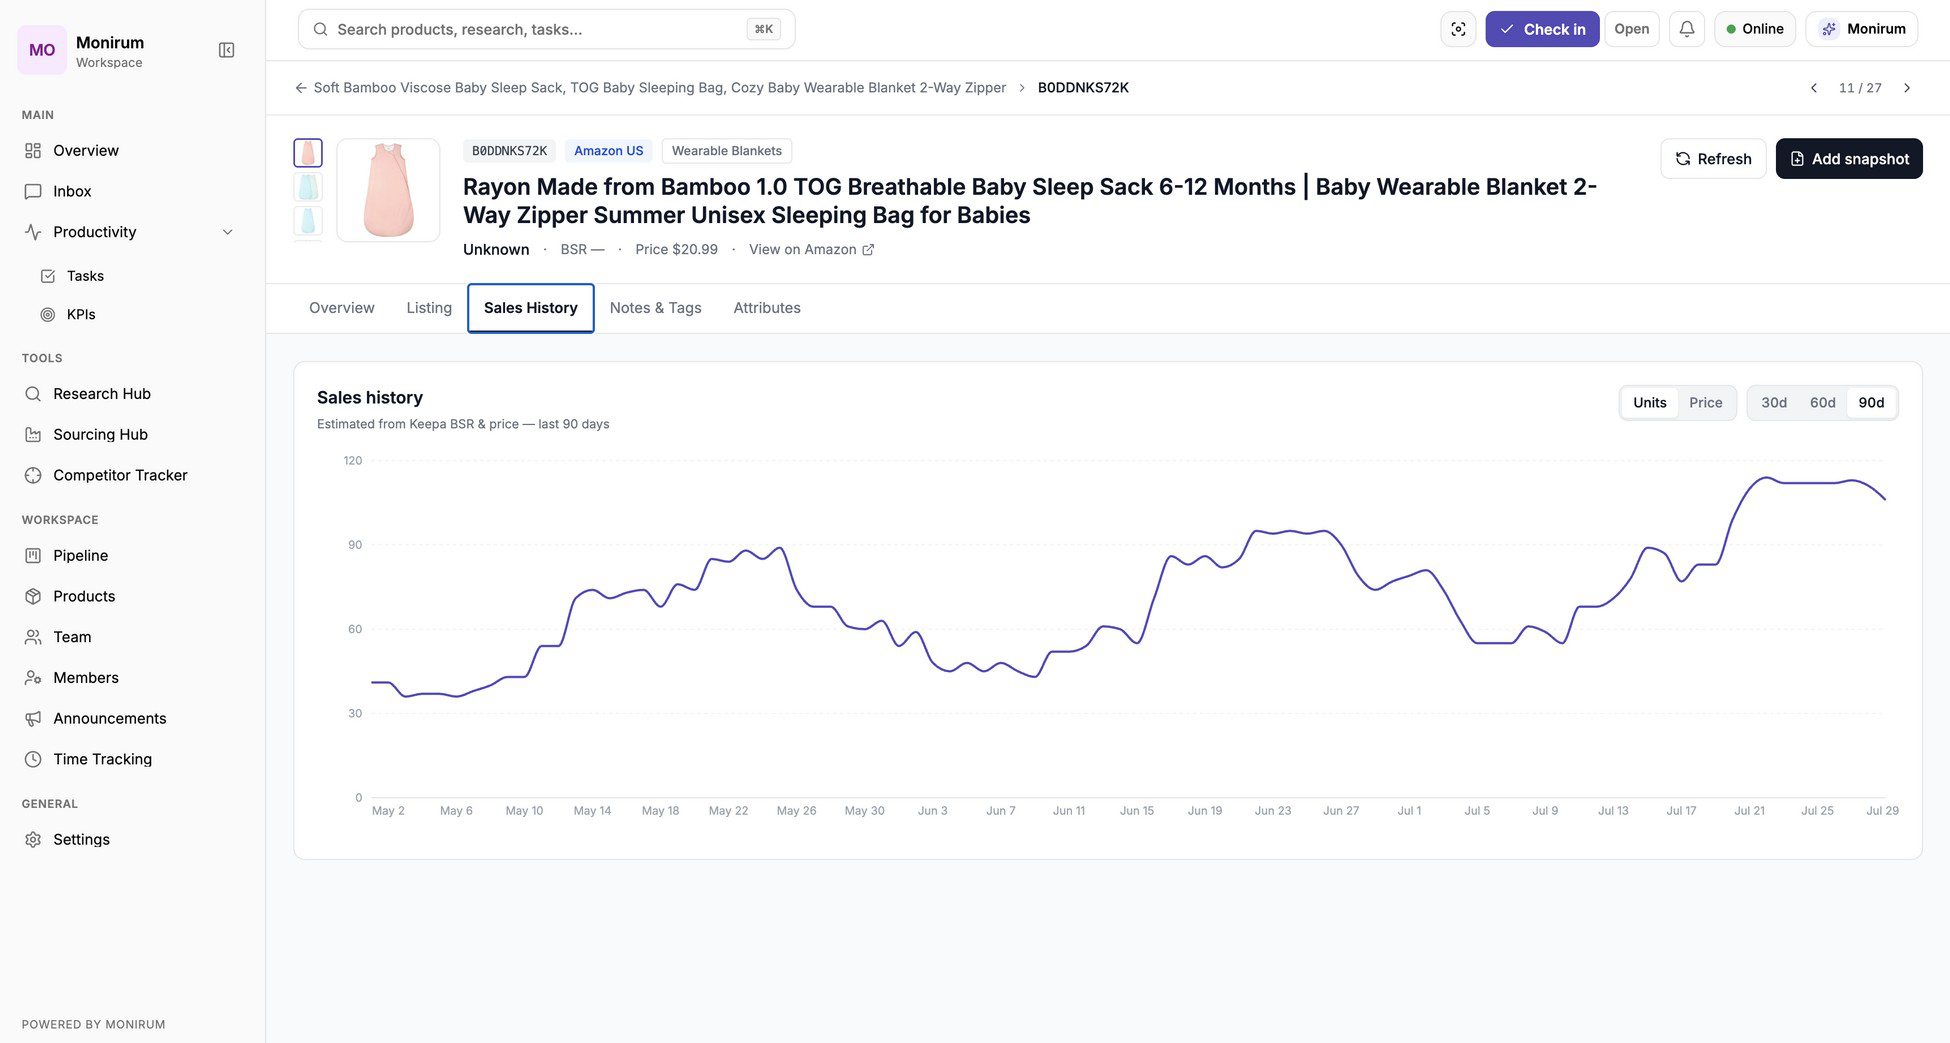
Looking at historical performance helps separate long-term demand from short-term fluctuations. A product may appear attractive after a strong month, but a broader view could reveal declining sales or recurring seasonal patterns. Likewise, temporary declines don't necessarily indicate a weak market if the overall trend remains healthy.
Three patterns are worth telling apart, because they look similar over a short window.
A seasonal pattern repeats. The same months rise and fall each year, and the peaks are roughly comparable. This is a planning problem rather than a demand problem: inventory has to arrive before the peak and the capital tied up during the slow months has to be survivable.
A trend doesn't repeat. Sales move in one direction across seasons. A rising trend in a category with new brands taking share usually means the market is still forming. A declining trend across all the leading listings, rather than one of them, is the more serious reading, because a new entrant inherits the decline.
A spike is a single event that doesn't recur. It can come from a promotion, a stockout at a competitor, or short-lived attention from outside Amazon. Building a forecast on a window that contains a spike is one of the more common ways a model ends up wrong, because the spike raises the average without raising the demand.
What matters is which listings show the pattern. When one competitor declines while the rest hold steady, the cause is usually that listing. When the whole top of the category moves together, the cause is the market.
Sales history also helps identify how consistent the leading sellers are. Markets where competitors maintain stable performance over time often behave differently from those where rankings and revenue change dramatically from month to month. Understanding these patterns provides a more realistic picture of the market before making an investment decision.
Price & Review Segmentation
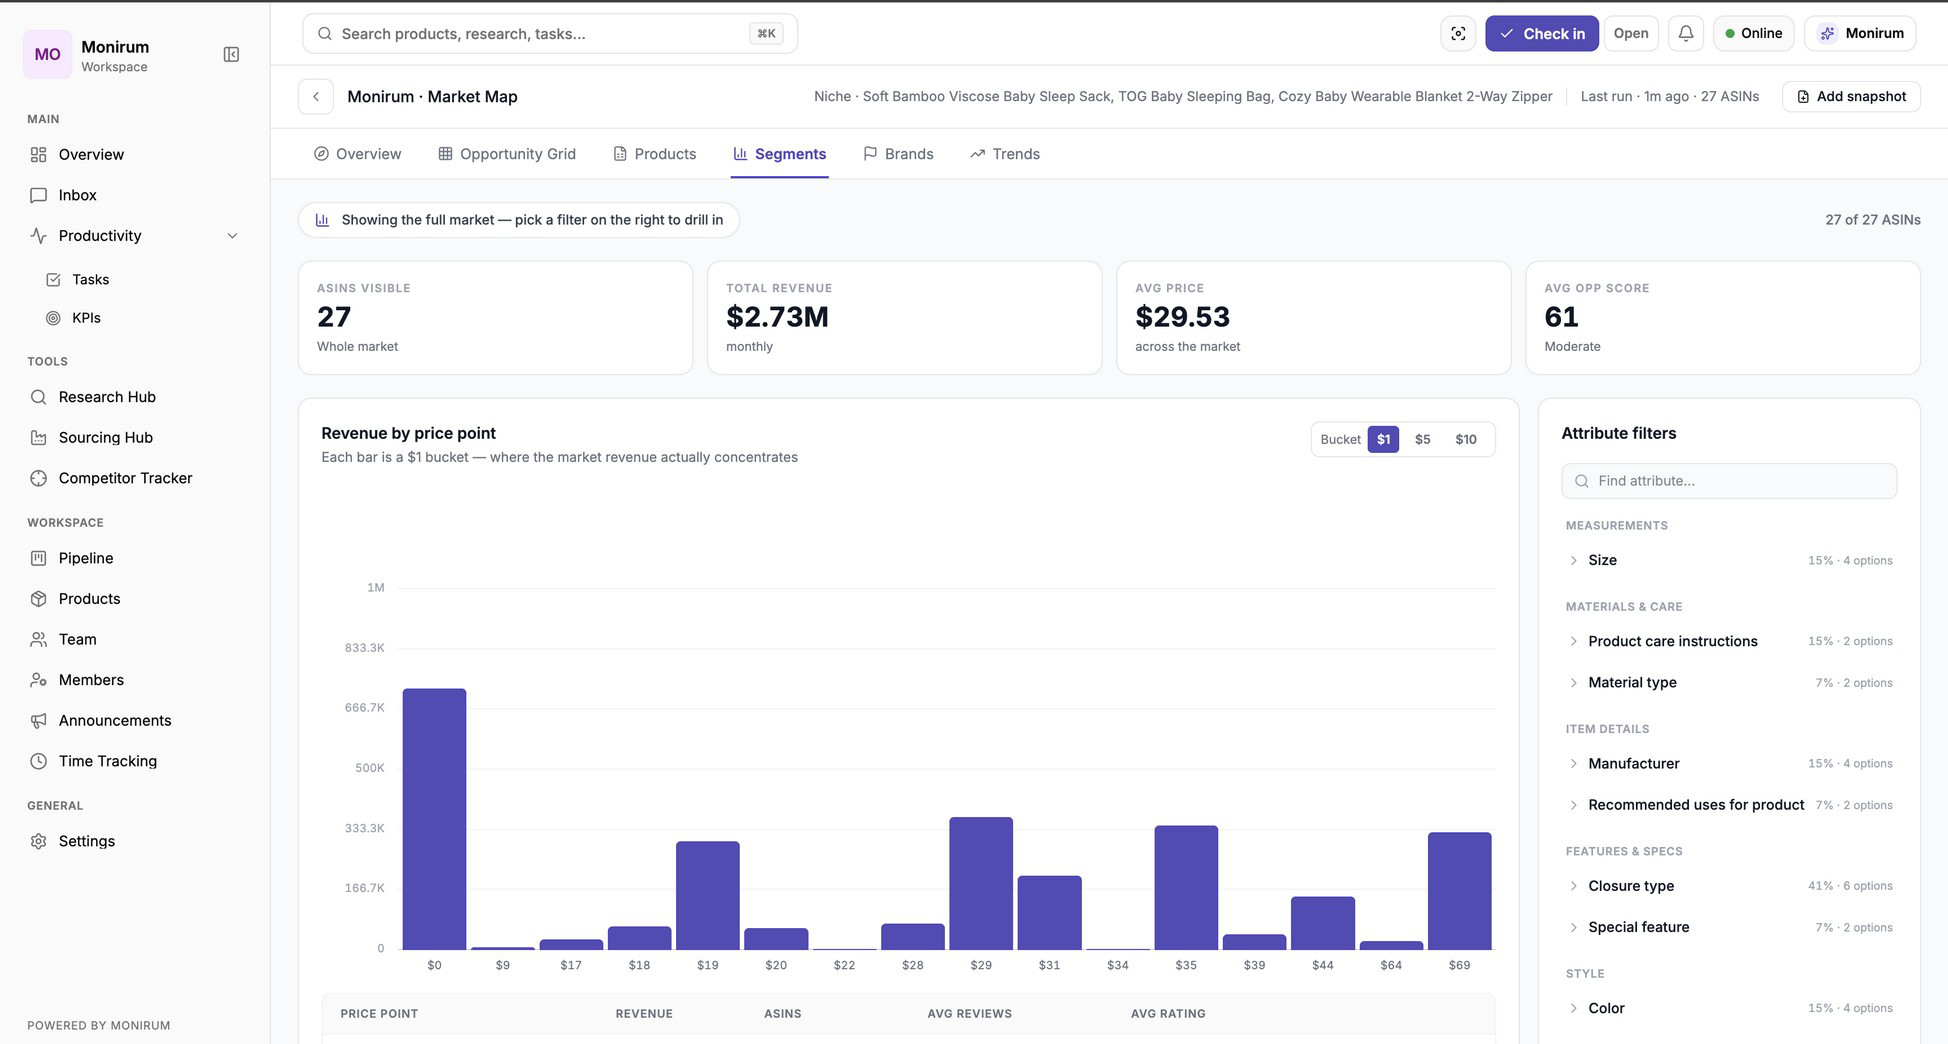
No market consists of products competing under the same conditions. Different price points attract different customer expectations, competition levels, and buying behavior. Understanding those segments makes it easier to evaluate where a product might realistically compete.
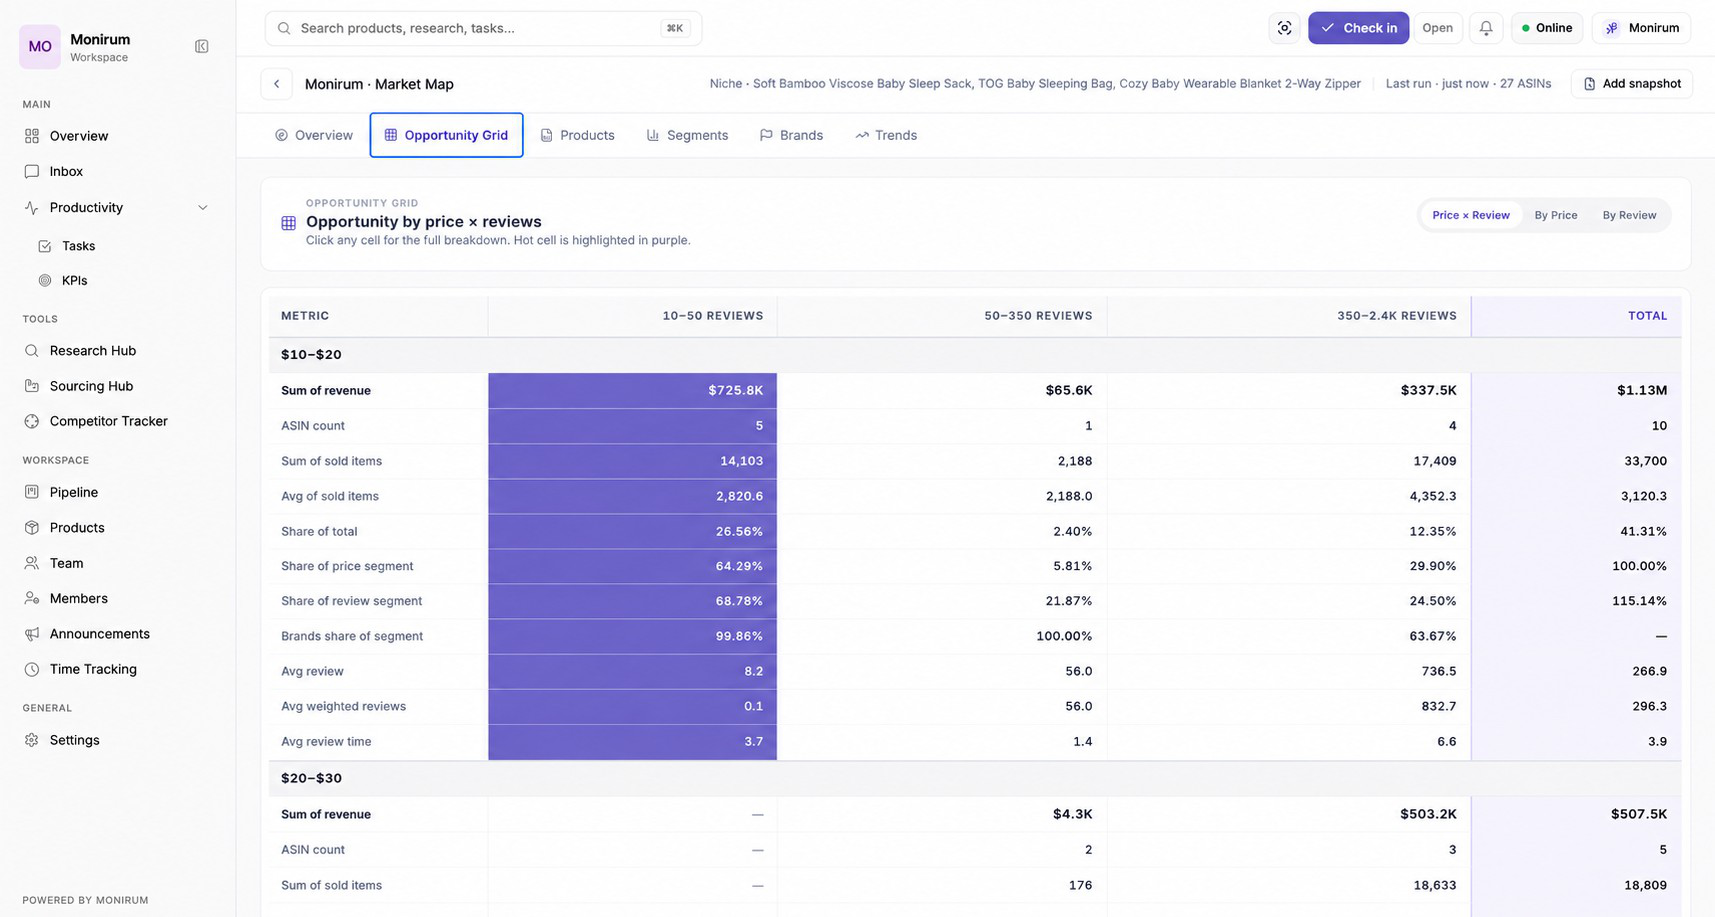
Instead of viewing the market as a single group of products, break it into meaningful segments based on price and review count. This makes it easier to identify where competitors are concentrated, which price ranges dominate the market, and whether certain segments are underserved or saturated.
Review count adds another layer of context. Products with similar prices may compete under completely different conditions depending on how much social proof they have built. A new product entering a market with established competitors faces different challenges than one entering a segment where successful products have relatively few reviews.
The reading comes from how price and reviews sit together, not from either one alone.
A band where products sell at high prices with low review counts is the one worth examining closely. It usually means recent entrants are charging a premium and customers are accepting it. Either those products offer something the rest of the market doesn't, which the feature analysis will show, or they haven't yet been tested at volume. Both are useful to know before setting a target price.
A band where prices are low and review counts are high is mature and defended. The products there have accumulated social proof over years, and a new listing competes against that history rather than against the product. Entering this band means accepting a long period of buying visibility, on margins that are already thin.
A band with very few products in it is the case most often misread as an opening. Empty space on the chart is not automatically demand. An empty band at a high price usually means customers in this category won't pay it. An empty band at a low price usually means the product can't be manufactured, shipped, and fulfilled for that price and still leave anything behind. The financial study answers which one is true, and it's worth carrying the question forward rather than treating the gap as a finding.
What this stage produces is the target price. Every number in the cost model is built on it, which makes it the single most consequential output of the market research.
Feature Analysis
Numbers explain how a market performs. Features explain why products succeed within it.
At this stage, the focus shifts from market-level analysis to the products themselves. Compare competitors across different price points and identify what customers receive at each level. Materials, dimensions, functionality, design, packaging, accessories, and overall positioning all contribute to the value being offered.
Looking at products individually provides limited context. Comparing them side by side makes it easier to understand which features are considered standard, which justify higher prices, and where competitors are differentiating themselves. It also helps identify whether higher-priced products genuinely deliver more value or simply rely on branding and positioning.
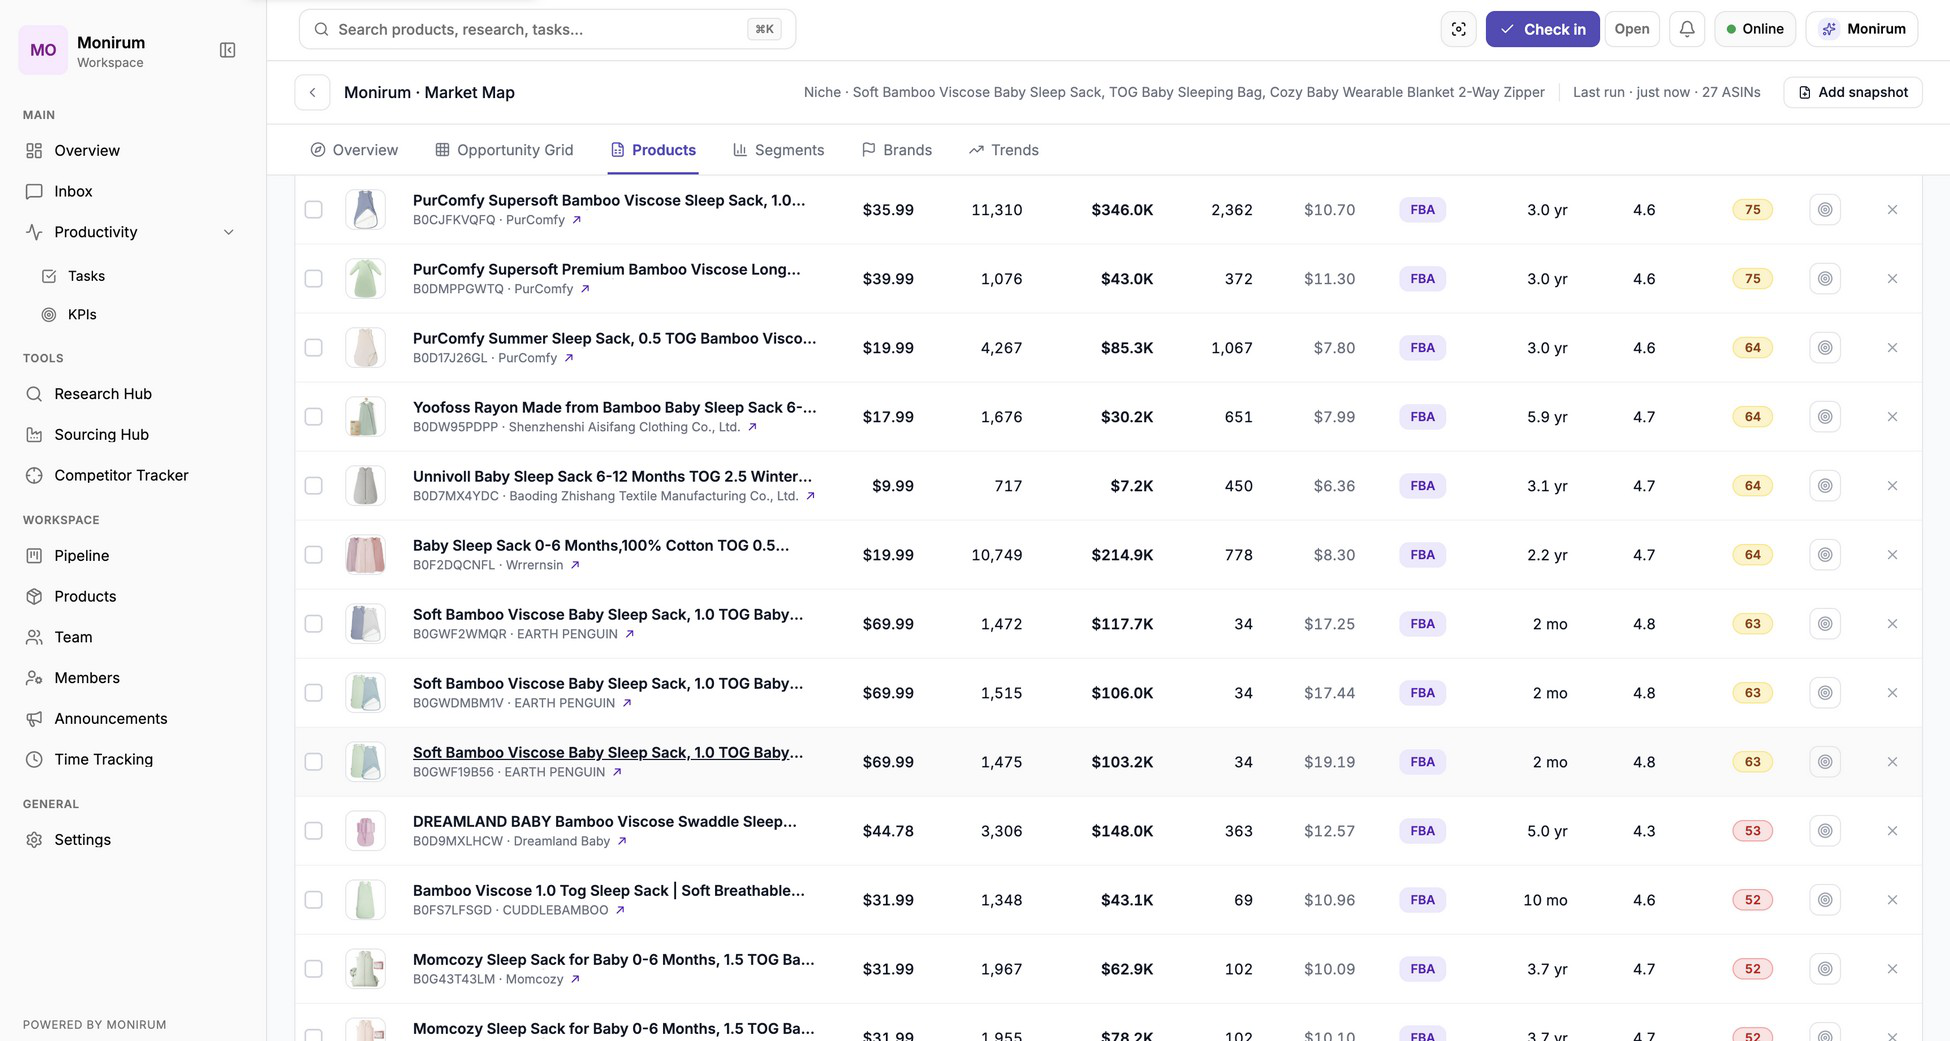
Once the comparison is built, features sort into three groups, and each one means something different for the product plan.
Features present at every price point are entry requirements. They don't differentiate anything and they can't be marketed, but leaving one out produces complaints and returns. These belong in the specification without discussion.
Features that appear only above a certain price are what the market has decided is worth paying for. This group defines the gap between price bands. If a product is meant to sit in a higher band, it needs enough of these to justify the position, and each one carries a manufacturing cost that has to survive the financial study.
Features absent across the entire comparison are the interesting group and the one that requires the most care. Their absence has two possible explanations. Either no competitor has thought of it, which is rare in a mature category, or it costs more than customers in this market will pay for it. Treating an absence as an opportunity without pricing it is how a differentiated product ends up unprofitable.
This analysis should also be combined with customer feedback. Repeated complaints, frequently requested improvements, and consistently praised features often reveal opportunities that aren't obvious from product listings alone. What the listings show and what buyers report after using the product are rarely the same picture. Feedback is examined properly in Phase 5, once the economics have been tested, so at this stage the reading is limited to what the comparison itself suggests.
The goal isn't to copy the best-selling product. It's to understand what the market already offers, what customers expect, and where a better product can be built.
Building the Product Plan
By this stage, the market should no longer be a collection of disconnected observations. Every stage of the research contributes to a clearer understanding of how the product should be positioned.
Market share reveals how revenue is distributed. Brand analysis identifies who controls that revenue. Sales history provides context on demand, while pricing, reviews, feature analysis, and customer feedback explain what customers expect and how competitors meet those expectations.
These findings become the foundation of the product plan. Rather than copying an existing product, the goal is to define what should be built based on the evidence gathered throughout the research. That includes the target price, feature set, positioning, and the improvements that will guide sourcing and product development.
This plan is a working specification rather than a final one. It reflects everything the market research revealed, but not yet what customers report after buying. Feedback research revises it, and the revisions carry costs that the financial study has to account for.
Market Research doesn't determine whether the product is financially viable. It defines what the product should become before any investment decisions are made.
Phase 4 · Financial Study
A strong market doesn't automatically make a strong business.
A product with strong demand, healthy competition, and clear differentiation isn't automatically a good business opportunity. Every decision still needs to be supported by realistic financial projections.
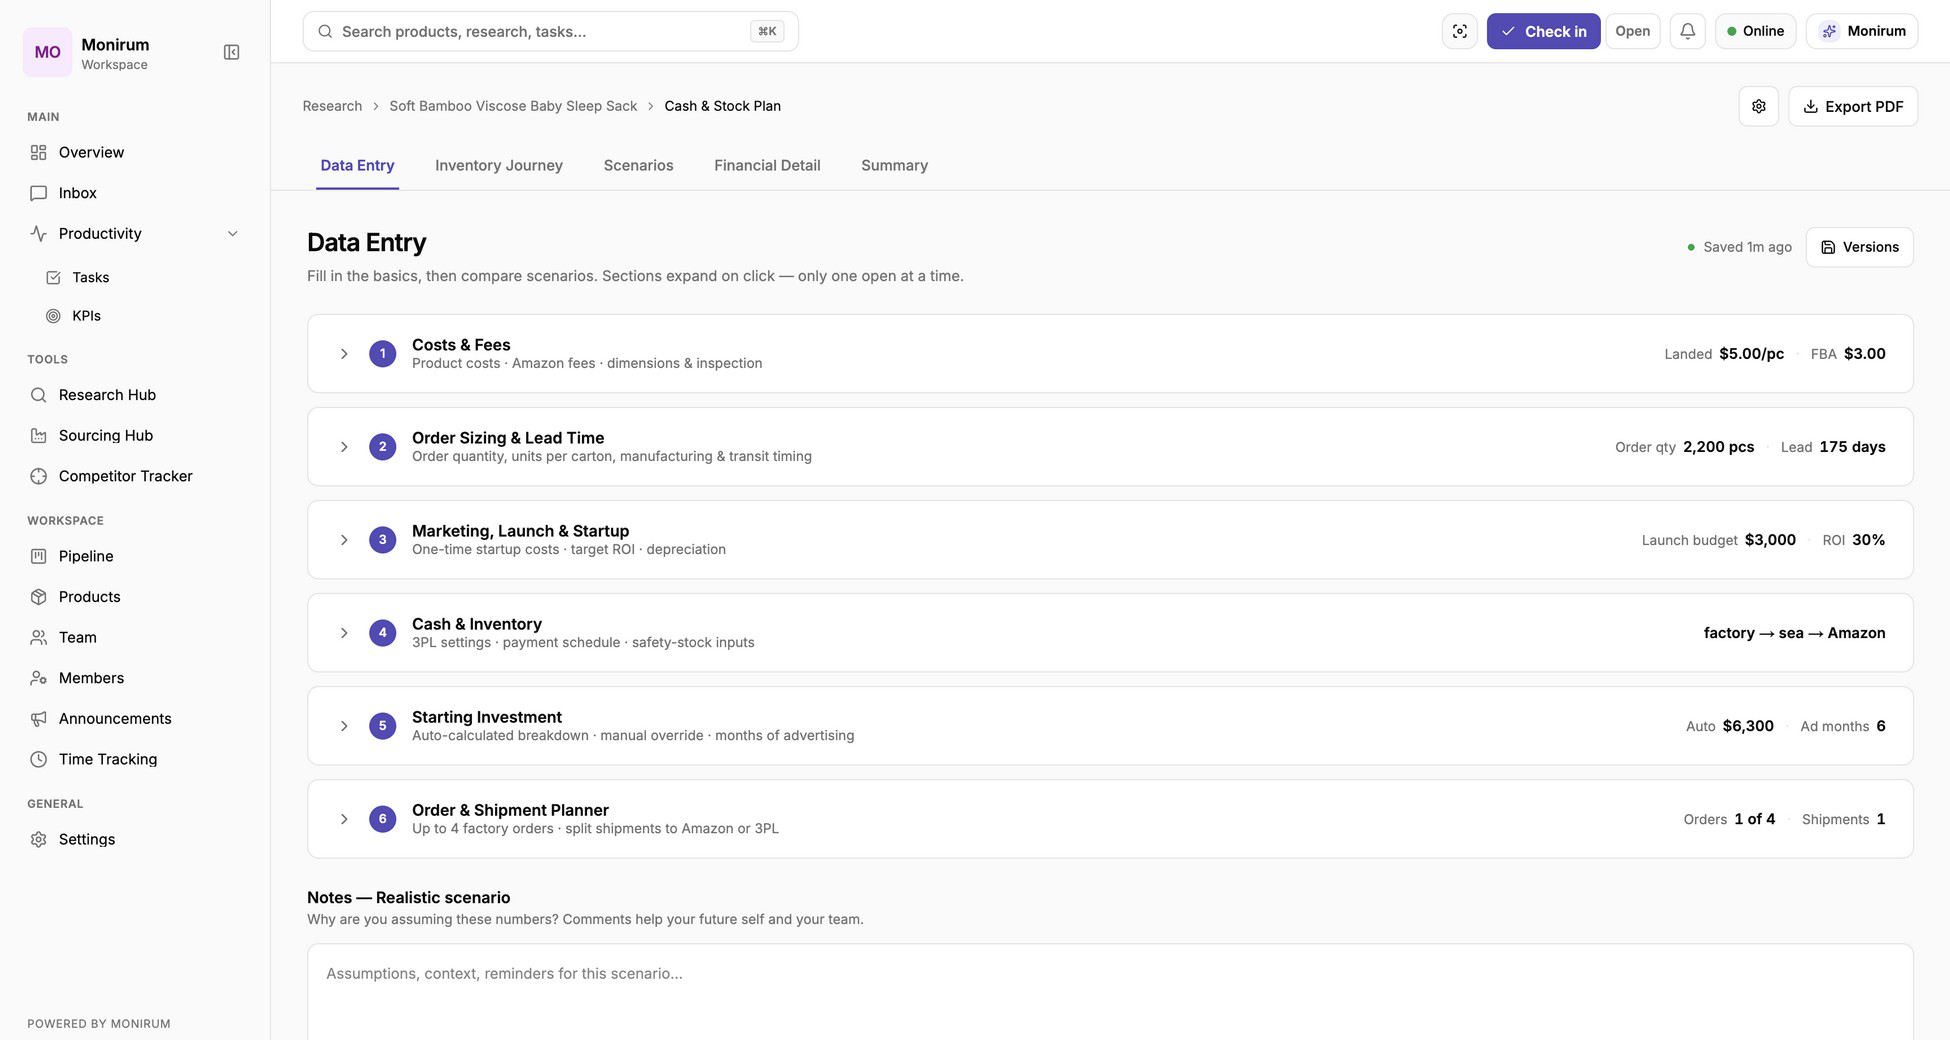
The purpose of this phase is to estimate the full cost of bringing the product to market, project its financial performance under different scenarios, and understand the capital required before making an investment decision.
Cost Analysis
Accurate financial planning starts with understanding the complete cost of bringing the product to market.
Manufacturing cost is only one part of the equation. Shipping, customs, Amazon fees, taxes, packaging, advertising, storage, and other operating expenses all contribute to the final cost of selling the product.
Missing or underestimating any of these costs can significantly affect profitability. Building a financial model around realistic assumptions provides a much more reliable foundation for evaluating the investment than focusing on manufacturing cost alone.
Costs behave differently from one another, and grouping them by behaviour rather than by name makes the model easier to test.
Some costs are fixed per unit regardless of what happens after launch. Manufacturing, packaging, and inspection sit here, and they are the costs a supplier quotation will eventually replace with real numbers.
Some scale with the product's physical properties. Fulfilment fees, storage, and freight all move with size and weight. Size tier deserves particular attention, because it moves fulfilment and storage together and the boundaries between tiers are narrow. Dimensions are often settled during sourcing without checking which side of a tier boundary the packed product lands on, and a small change in packaging can move the entire cost structure.
Some scale with price. Referral fees and returns are proportional, which means a higher target price doesn't carry as much of its increase to the bottom line as it first appears.
And some scale with competition rather than with the product at all. Advertising is the main one, and it is the cost most often underestimated, usually by treating it as a launch expense that ends once the product ranks. In competitive categories it doesn't end. A model that assumes advertising falls away after the first months is describing a market that has stopped defending itself.
The purpose of this stage isn't to predict every expense with perfect accuracy. It is to build a financial model that reflects the economics of the business and can be refined as more accurate supplier quotations and shipping costs become available.
Profitability Analysis
Once the cost structure has been established, the next step is evaluating the product's financial performance.
Profitability isn't determined by revenue alone. It depends on how efficiently revenue is converted into profit after accounting for every expected expense. Even products with strong sales can become poor investments if operating costs leave little room for sustainable profit.
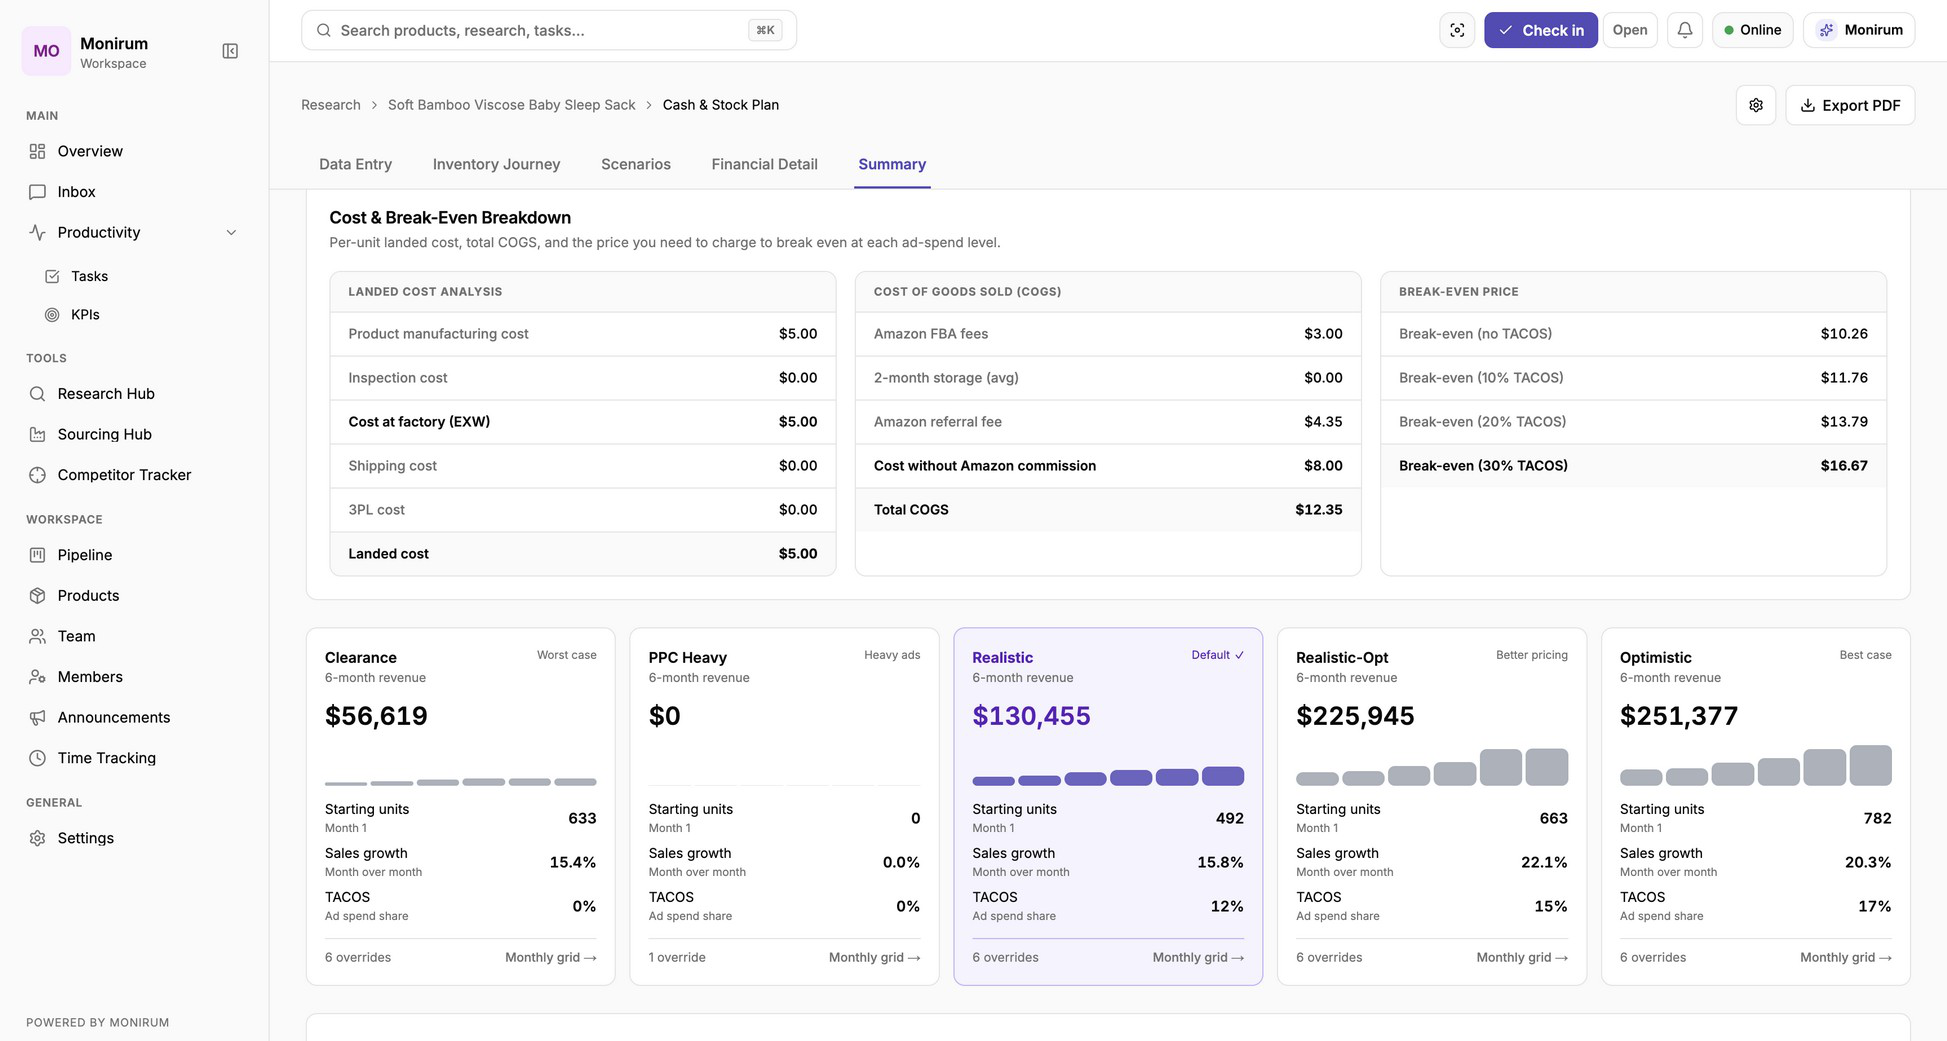
This stage brings the financial model together by estimating key performance metrics such as gross profit, net profit, and profit margin. Rather than focusing on a single number, the analysis evaluates how changes in pricing, advertising, or operating costs affect the overall performance of the business.
The objective isn't to maximize projected profit. It's to determine whether the business can generate consistent returns while remaining resilient to the changes that naturally occur after launch.
Scenario Analysis
Every financial model is built on assumptions, but real businesses rarely perform exactly as expected. Sales fluctuate, advertising costs change, supplier pricing evolves, and unexpected expenses are part of every product launch. Relying on a single financial projection assumes everything will happen exactly as planned, which is rarely the case.
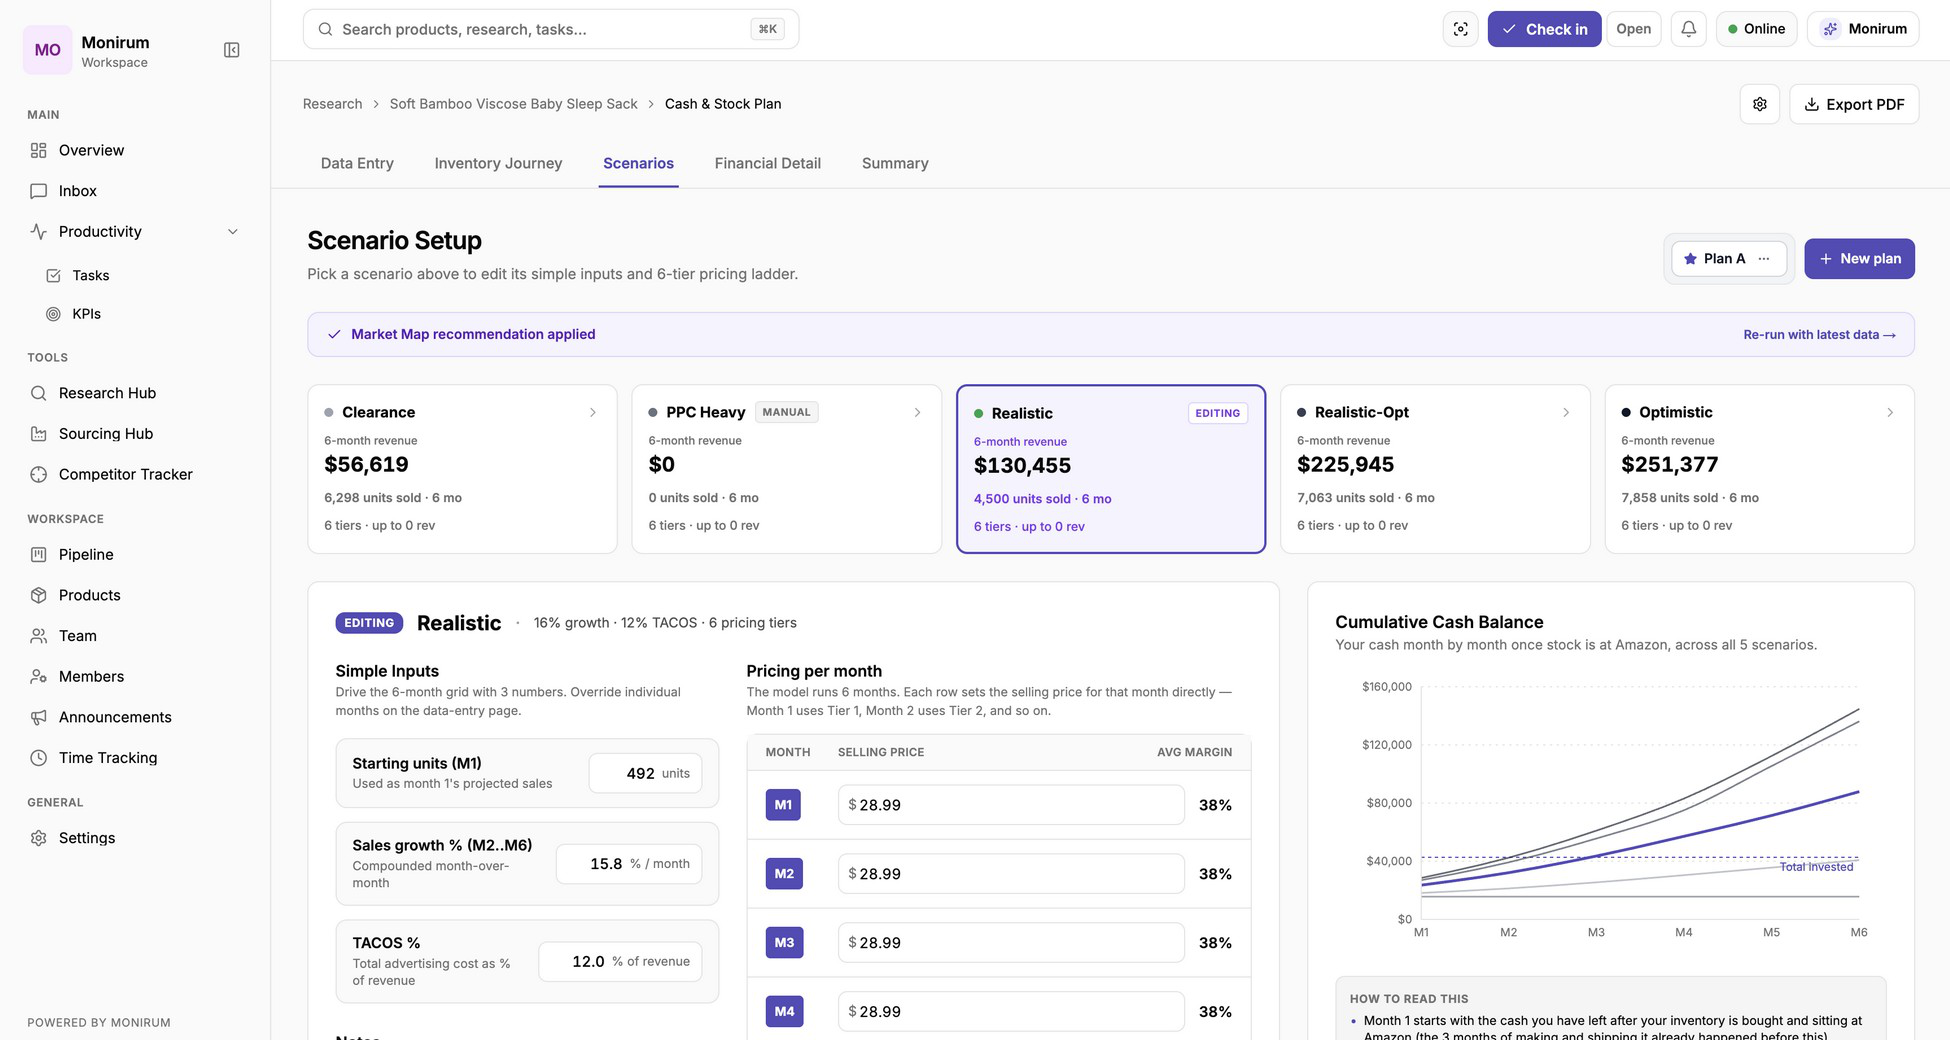
Instead, evaluate the business under multiple scenarios. A conservative scenario measures the downside risk, a realistic scenario reflects the most likely outcome, and an optimistic scenario estimates the potential if the launch performs better than expected. Each scenario uses different assumptions to show how changes in performance affect profitability, cash flow, and the overall investment.
Scenarios are only useful if the right inputs are varied. Moving every assumption at once produces a range so wide that it supports any conclusion. The inputs worth varying are the ones with the widest realistic spread, which are usually sales volume, advertising cost per sale, and freight, since all three can differ substantially from the estimate without anything having gone wrong.
The conservative case is not read against zero. It is read against the capital available. The question is not whether the product is profitable in the downside case but whether the business can fund the downside case for long enough to reach the realistic one. A product that is unprofitable for two quarters is a different proposition depending on whether the business can absorb two quarters.
There is one result worth watching for. If almost the entire gap between the conservative and optimistic cases traces back to a single input, that input is the real risk in the investment, and it deserves better information before an order is placed rather than a wider range in the model. A freight quotation or a supplier's actual unit price often costs nothing but time to obtain.
The objective isn't to determine which scenario is most likely to happen. It's to understand how resilient the business remains when conditions change. A product that only succeeds under perfect assumptions carries far more risk than one that continues to perform well across a range of realistic outcomes.
Capital Planning
Profitability alone doesn't determine whether a product is a good investment. The capital required to launch and sustain the business is equally important.
A profitable product may still be impractical if it requires more inventory, cash flow, or upfront investment than the business can reasonably support. Understanding those requirements before placing the first order reduces the risk of cash shortages during the launch and growth stages.
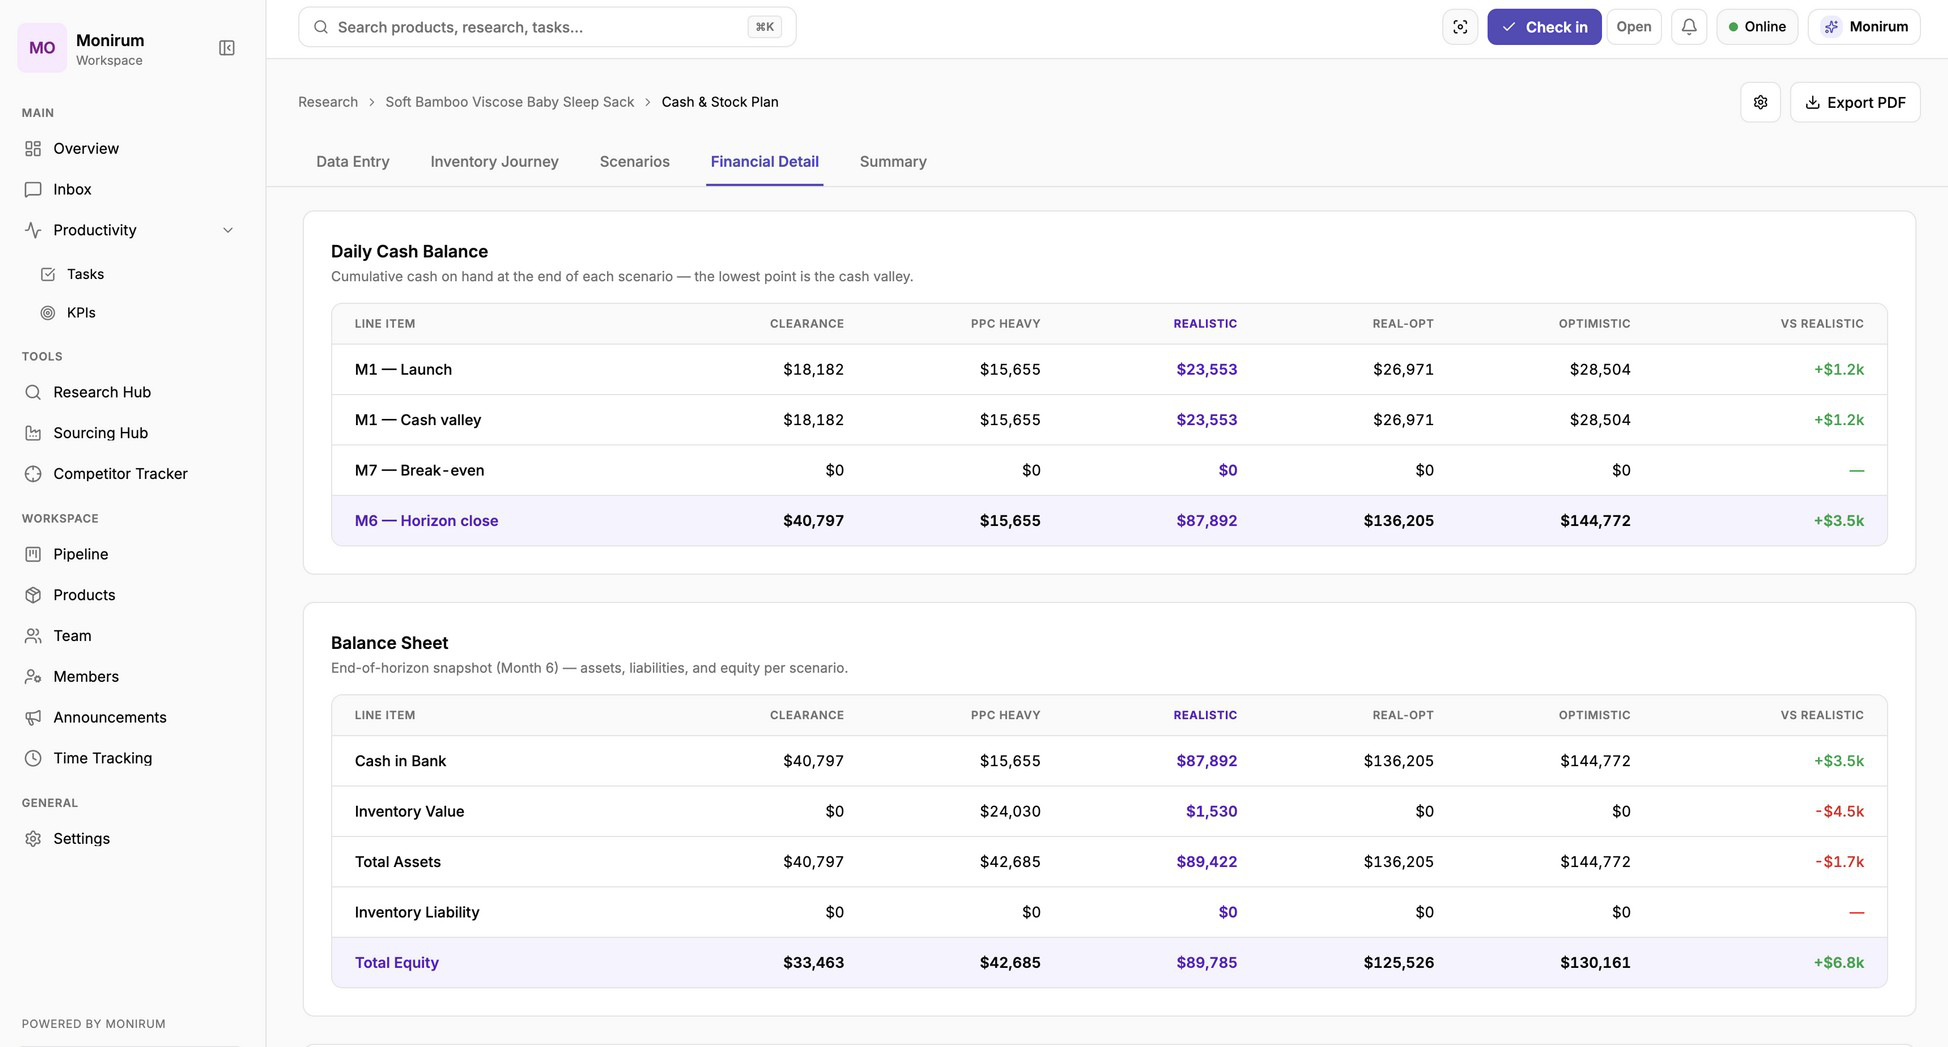
Capital planning estimates the investment required throughout the product's journey, from manufacturing and shipping to inventory, advertising, and operating expenses. Rather than focusing only on the initial order, it considers the financial commitment needed to keep the business operating until it becomes self-sustaining.
The number that decides the question is the deepest point, not the total. Total investment across a year says little about whether the business can carry the product, because the money doesn't leave all at once and it doesn't come back evenly.
Cash is furthest out somewhere after the second order has been paid for and before the first order has finished paying the business back. Supplier terms determine how early the money leaves, and disbursement schedules determine how late it returns. The gap between those two is where products fail despite being profitable on paper.
When the deepest point sits close to the capital available, the product only works if nothing goes wrong. Production delays, a slower launch than expected, or a customs hold each move that point further out. The realistic options are a smaller first order, which raises the unit cost and weakens the margin, or a different product. Both are better than discovering the constraint after the supplier has been paid.
The objective is to determine whether the opportunity aligns with the resources available to the business. A product that requires more capital than the business can comfortably invest may not be the right opportunity, regardless of its projected profitability.
Inventory Journey
Launching a product is only the beginning of the investment. As inventory moves through manufacturing, shipping, storage, and sales, capital is continuously tied up before it returns to the business.
Understanding that journey is essential for planning future inventory purchases and maintaining healthy cash flow. Running out of stock slows growth, while overordering can leave significant capital locked in inventory for extended periods.
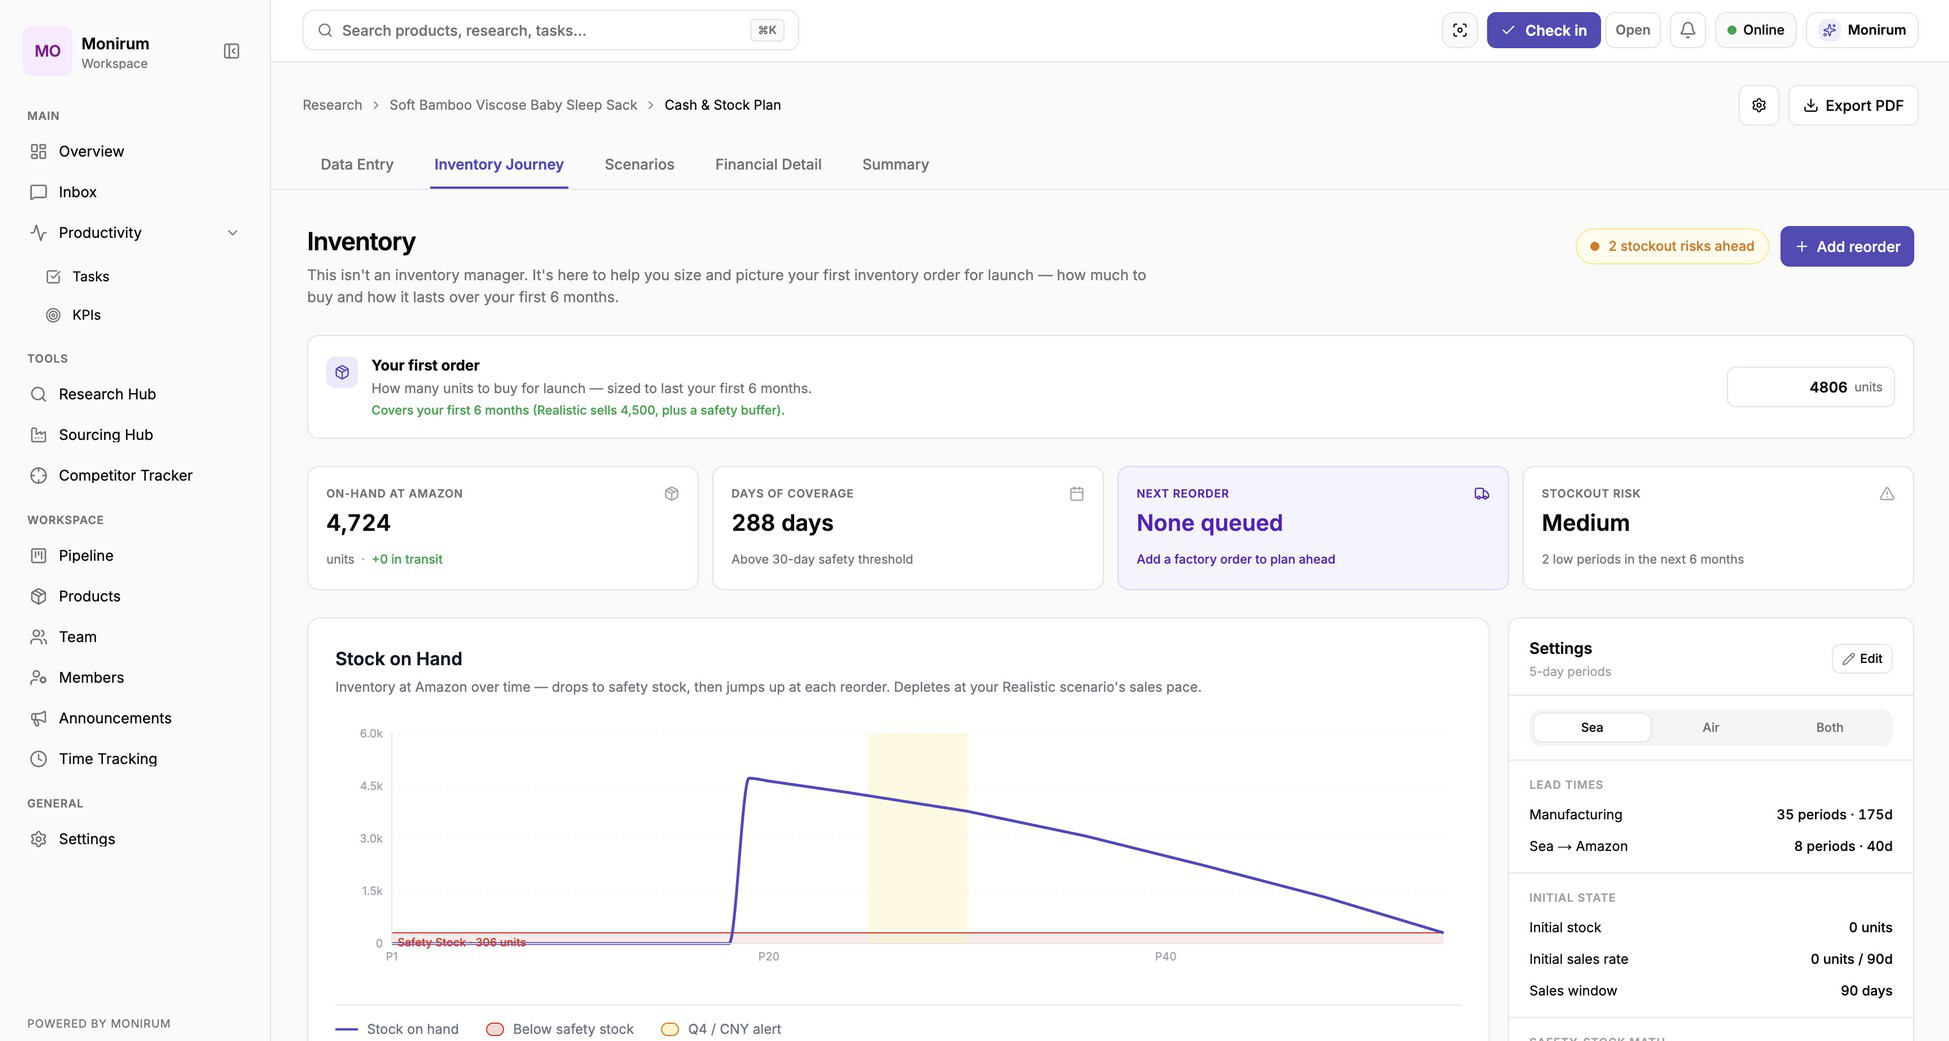
Mapping the inventory journey provides a clearer view of how inventory levels, reorder timing, and available capital change over time. Instead of evaluating a single purchase in isolation, the analysis considers how each inventory cycle affects the next.
This allows inventory decisions to be planned before they become urgent, reducing the likelihood of stockouts, unnecessary storage costs, and cash flow constraints as the business grows.
Phase 5 · Feedback Research
Every stage so far has evaluated the product without hearing from anyone who bought one. This stage comes last for a practical reason. Reading competitor reviews in enough volume to separate real patterns from isolated complaints is the slowest work in the process, and it produces nothing worth having about a product whose economics don't hold.
Customer feedback provides a perspective that market research cannot. It reveals how the product performs after the purchase and highlights the issues customers experience during real-world use.

The objective is to identify recurring problems, feature requests, and the product attributes customers value most. Those findings become the foundation for improving the product before sourcing, helping avoid weaknesses that already exist in competing products.

AI can carry most of the reading once the reviews are collected. Feed it the review text from the leading competitors, weighted toward lower ratings and recent months, since older reviews often describe versions of the product that have since changed. Ask for recurring complaints grouped by theme with a count for each, kept separate from one-off issues. What you want back is three lists: problems frequent enough to be design faults rather than defects, features customers ask for that no competitor offers, and attributes they praise that a new product shouldn't change.
Feedback research usually changes the product, and a better material, an added component, or revised dimensions all carry a cost that wasn't in the model. Every change coming out of this stage goes back through the cost analysis before the decision is made.
Conclusion
Every product has potential. The challenge is deciding whether that potential justifies the investment.
The decision doesn't rest on a single metric. A product with strong demand may require more capital than the business can support. A highly profitable product may sit in a market that doesn't fit the strategy. A lower-margin product may still be the right investment if it serves the longer-term objectives. Each of those conflicts is only visible because the earlier stages produced enough information to see them.
A structured process doesn't guarantee a successful product. It produces a decision supported by the complete picture rather than by intuition, and a clear record of what was assumed at each stage, so that when conditions change after launch it's possible to know which part of the reasoning has to be revisited.